 |
VOOZH | about |
|
VOOZH | about |
Polar axes are coordinate axes where the two coordinate axes are r-axis for magnitude and theta-axis for angles. MATLAB has many functions to change the properties of these polar axes which we shall see throughout this article. In this article we shall see how to modify following properties of polar axes in MATLAB:
Let us see each of these with an example each.
MATLAB provides us with options to change the limits of r and theta axis by using the rlim() and thetalim() functions.
Syntax:
rlim(<limits of r-axis>)
thetalim(<limits of theta-axis>)
We can pass a certain range for the limits of r-axis and theta-axis and the above functions will change the visible range of the polar axes. We will plot a sin curve in polar axes with theta ranging from 0 to 270 degrees and r ranging from 0 to 1.5.
Example 1:
Output:
We can change where the ticks are marked on r and theta axes using the following functions.
Syntax:
rticks(<vector with tick values>)
thetaticks(<vectors with tick values in degrees>)
See the following example for understanding the above functions.
Example 2:
Output:
Just as we changed the tick values in the above example, we can change the labels given to those ticks as well using the following functions.
Syntax:
rticklabels(<labels>)
thetaticklabels(<labels>)
We will now plot the trigonometric identity sin2(r) + cos2(r) = 1, in polar frames with only the 4 directions on the theta axis.
Example 3:
Output:
We can change the orientation of r-tick labels in which they are displayed. There is a simple function for the same.
Syntax:
rtickangle(<angle of rotation>)
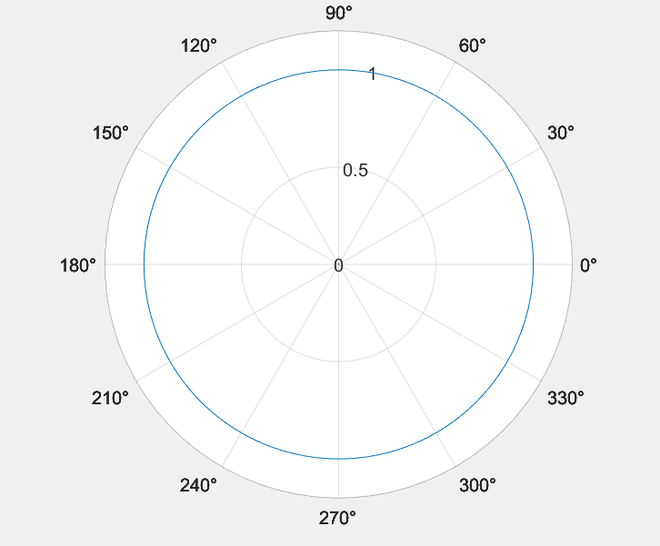
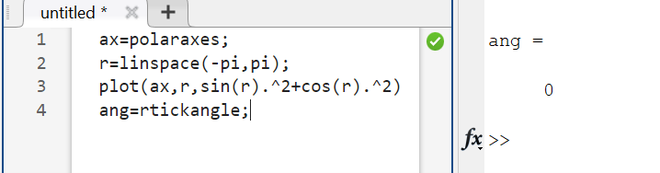
We can use the above function without an argument to query the current r-tick angle. Getting the current rotation angle. Consider the following plot.
We can query its rtickangle like following.
Example 4:
Output:
As we can see, the default angle of r-ticks is 0 degrees.
Output: