 |
VOOZH | about |
|
VOOZH | about |
A Pie chart is a circular graph that is divided into sections and each section represents the proportionate part of the whole. In MATLAB we have a function named pie() which allows us to plot a bar graph.
Syntax:
pie(X)
pie(X) draws a pie chart using the data in X. Each slice of the pie chart represents an element in X.
- Where the sum(X) ≤ 1, then the areas of the pie slices directly specify the values in X pie draws only a partial pie if sum(X) < 1.
- Where the sum(X) > 1, then the area of each slice of the pie is determined by pie normalizes the values by X/sum(X)
- Here let X be a categorical data type, the slices correspond to categories. The number of elements in the category divided by the number of elements in X becomes The area of each slice.
Now let's move to some examples.
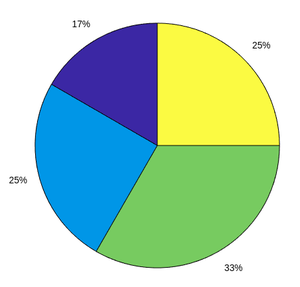
Example 1: A simple pie chart:
Output :
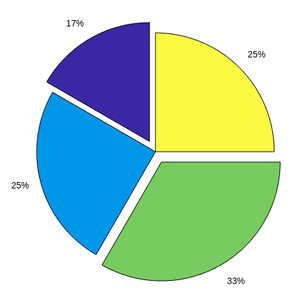
Example 2: Pie chart with offset:
Output :
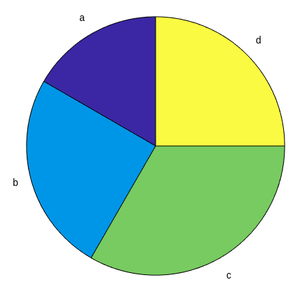
Example 3: Pie chart with labels:
Output :
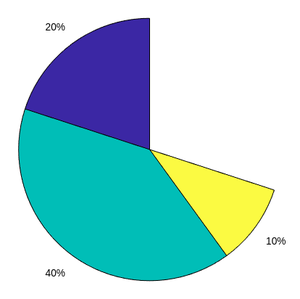
Example 4: Partial Pie chart:
Output :
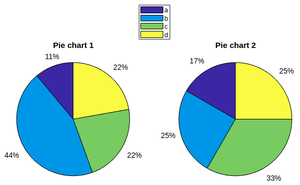
Example 5: Compare 2 pie charts:
Output :