 |
VOOZH | about |
|
VOOZH | about |
Your cloud team walks into the quarterly review. “We hit 82% Reserved Instance coverage,” they announce. Everyone nods approvingly.
Three months later, the AWS bill is up 14%.
If that sounds familiar, you’re not alone. Many teams optimize for coverage or utilization metrics, only to find that actual savings don’t follow. The problem isn’t effort, it’s measuring the wrong thing.
Effective Savings Rate (ESR) changes that. It measures what matters: how much you’re saving versus on-demand prices. It distills down to a single outcome metric, i.e. the savings you actually realized.
In this guide, we’ll cover how to calculate your ESR, what our proprietary benchmark data says about real-world performance, and what separates world-class operators from everyone else (consistently hitting 35-50%+ ESR month after month).
Effective Savings Rate (ESR) is a FinOps metric that shows your actual savings rate versus on-demand list pricing over a given period (typically monthly). The FinOps Foundation describes ESR as the “Return on Investment (ROI) for cloud discount instruments,” the output metric that reflects true savings performance.
ESR captures the real discount you’re receiving from commitments and rate levers (like Savings Plans, Reserved Instances, Committed Use Discounts, Azure Reservations, private rates, and Spot). That makes ESR the cleanest KPI to report to finance: one number that captures whether your commitment strategy is delivering.
The FinOps Foundation calls ESR “the Return on Investment for cloud discount instruments”. If anything, that’s underselling it. ESR captures your actual cloud pricing efficiency in one number.
The core formula for calculating ESR is:
Breaking it down:
Or, another way of calculating the same is
Breaking it down:
Let’s look at a real-world example showing that ESR is a superior metric to track compared to coverage.
Effective Savings Rate on your Q4 2025 infrastructure:
Coverage Rate for the same infrastructure during the same period
Which tells the real story? That 93% suggesting near-perfect optimization? Or 35% showing your real savings rate??
ESR focuses on commitment-eligible compute:
Storage (S3) doesn’t have commitments; they’re out.
So why do coverage and utilization metrics often paint a misleading story? Because they measure inputs, not outcomes, and they break down under normal infrastructure change.
Let’s take a quick look at how coverage, utilization, discount and ESR metrics compare under various common scenarios.
| Scenario | Coverage | Utilization | Discount | ESR | What's Really Happening |
|---|---|---|---|---|---|
| "Optimized" | 85% | 70% | 40% | 24% | Wasting 76% of potential |
| Selective | 60% | 95% | 45% | 26% | Better ESR, lower coverage |
| Overcommitted | 95% | 55% | 42% | 22% | High coverage, poor returns |
| Dynamic | 75% | 92% | 48% | 33% | Balance wins |
Scenario | Coverage | Utilization | Discount | ESR | What’s Really Happening |
“Optimized” | 85% | 70% | 40% | 24% | Wasting 76% of potential |
Selective | 60% | 95% | 45% | 26% | Better ESR, lower coverage |
Overcommitted | 95% | 55% | 42% | 22% | High coverage, poor returns |
Dynamic | 75% | 92% | 48% | 33% | Balance wins |
The pattern is clear: coverage doesn’t equal performance.
nOps manages thousands of cloud accounts across AWS, Azure and GCP.
We took a look at anonymized cloud data across across organizations pursuing a variety of optimization approaches.
The brual truth:
| Percentile | Rank | Effective Savings Rate |
|---|---|---|
| 98th percentile | World-Class | 51% ESR |
| 75th Percentile | Above average | 31% ESR |
| 50th percentile | Median | 18% ESR |
| 25th percentile | Below Average | 3% ESR |
Read that again. Half of all organizations achieve less than 18% ESR, while they could be effectively doubling or tripling their savings
Let’s take a look at some factors that characterize each rank:
35-50% ESR (Best-in-class)
18-30% ESR (Market average)
Below 15% ESR (Structural problems)
Scale and industry factors are also relevant — big spenders averaging $10 million annually or more, SaaS companies, and cloud-native companies tend to perform slightly better on average ESR.
ESR is pure fuel for profit margin. Let’s model real impact across spending tiers to see how quickly it compounds.
$5M Annual Compute:
$25M Annual Compute:
$100M Annual Compute:
Take a company with $100M in revenue and $10M in annual cloud spend.
If we improve effective savings rate (ESR) from 20% to 35%, that’s an incremental $1.5M in EBITDA.
That translates to a 1.5% operating margin improvement.
At a 20x EBITDA multiple, that $1.5M improvement drives approximately $30M in additional enterprise value.
This is board-level financial impact.
Conversely, low ESR can be a huge drag on profits. Beyond direct losses:
If your Effective Savings Rate is lower than expected, it’s typically the result of structural patterns in how commitments are bought, managed, and adjusted over time.
Below are the most common causes of low ESR we’ve seen in customer environments before optimization.
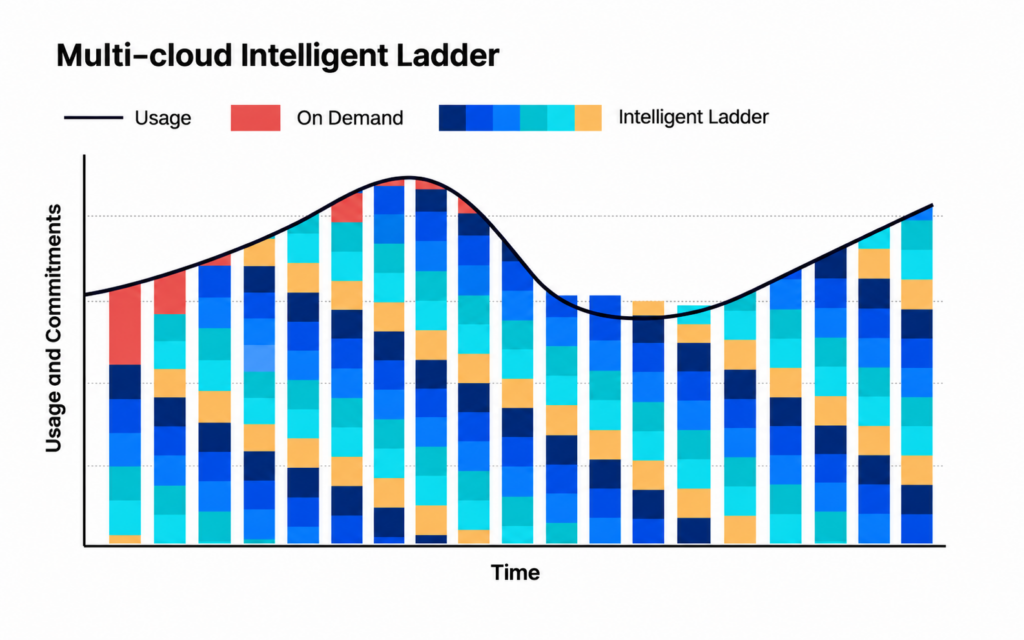
Hitting a high ESR consistently comes down to process. Below are the practices leading teams use to keep commitments aligned as usage changes.
To get maximum benefit, you have to manage commitments hourly, because usage changes continuously. The goal is to catch drift as it starts—before it turns into weeks of underutilization or on-demand exposure—and then make small adjustments on a steady cadence rather than large risky bets.
Smaller, incremental commitments reduce timing risk, allow gradual scaling up and down, and make realignment manageable.
Here’s a simple example of where a company with $10M in annual compute spend might land in terms of commitment mix, each split over hundreds or thousands of individual commitments.
Like investing, diversify commitments:
Type | Allocation | Use Case | ESR Impact |
3-year Compute SP | 25-35% | Stable base | Up to 66% discount |
1-year EC2 SP | 20-30% | Predictable families | 40-50% discount |
Convertible RIs | 15-25% | Some flexibility needed | 35-45% discount |
Spot | 10-20% | Fault-tolerant work | Up to 90% discount |
On-Demand | 10-15% | Pure flexibility | 0% but agile |
At scale, managing commitments manually is not realistic. Usage shifts hourly across services, accounts, instance families, regions, and architectures. A single change—an autoscaling adjustment, a deployment, a regional failover—can alter commitment alignment immediately. Tracking that manually across hundreds of commitments and thousands of resources simply doesn’t scale.
Sustaining a high ESR requires continuous portfolio management: detecting drift as it happens, evaluating its financial impact, and adjusting exposure in small increments before inefficiencies compound. That means orchestrating purchases, expirations, sharing rules, and risk thresholds across the entire organization
Account silos reduce ESR because commitments and usage don’t stay neatly contained in the same place, so high-performing teams manage commitments at the org level:
Commitments work best when the environment is designed to stay compatible with them. Teams with strong ESR reduce avoidable churn and keep workloads “commitment-friendly” by:
Skip the complex tools. Here’s ESR calculation using AWS Cost Explorer.
ESR = 1 – (Amortized Cost / On-Demand Equivalent)
Real example:
| Your ESR | Meaning | Next Steps |
|---|---|---|
| <15% | Severe Issues | Emergency Review |
| 15-25% | Below Average | Find Biggest Gaps |
| 25-35% | Competitive | Keep Improving |
| 35-45% | Above Average | Fine-Tune |
| >45% | Best In Class | Share Secrets! |
Want to go a little more involved than a single ESR number? Segment ESR so you can see exactly where savings performance is strong (or weak):
Service: EC2 vs. Lambda vs. Fargate — which services are driving (or dragging) your realized savings?
Account: which teams/accounts consistently optimize well, and which need attention?
Region: where are you overcommitted or underutilized based on regional usage patterns?
Instance family: which families drift most over time, creating mismatch and waste?
Time: how is ESR trending month-over-month, and what changed when it moved?
And rather than piecing this together yourself, why not have nOps do it for you? We can run a free ESR analysis to benchmark where you are today, pinpoint the biggest drivers of variance across those segments, and quantify the realistic improvement range—so you walk away with clear, prioritized next steps.
The data’s stark — many organizations hit 0% ESR despite extensive commitments. But leaders achieving 35-50% prove dramatic gains are possible.
This is where nOps comes in, as a purpose-built automation platform designed to maximize your ESR on autopilot, freeing your engineering team to focus on building and innovating.
nOps continuously adjusts commitments in small increments based on real demand, helping teams achieve optimal savings rates without risk or manual overhead.
nOps only gets paid after it saves you money. There’s no upfront cost, no long-term commitment, and no risk or downside — if nOps doesn’t deliver measurable savings, you don’t pay.
Want to see it in practice? Book a demo to get a free savings analysis of your AWS/Azure/GCP spend.
nOps manages $3B+ in cloud spend and was recently rated #1 in G2’s Cloud Cost Management category.
Last Updated: June 7, 2026, Commitment Management
Last Updated: June 7, 2026, Commitment Management
AI-powered rate optimization with risk-free guarantee
AI-powered commitment management with risk-free guarantee