 |
VOOZH | about |
|
VOOZH | about |
Kubernetes is a highly popular open-source platform that automates containerized applications’ deployment, scaling, and management. Kubernetes is widely used for managing cloud-native applications and has become an industry standard for container orchestration. It makes it easier for organizations to deploy and manage applications at scale, but with this increased complexity, monitoring Kubernetes clusters has become critical for ensuring the health and performance of the applications it manages.
Thus to help you out, this article will discuss the ultimate guide to Kubernetes monitoring tools. We will start by discussing Kubernetes monitoring, its benefits, and the top Kubernetes monitoring tools your business needs!
Kubernetes monitoring is a process of collecting and analyzing data from your Kubernetes cluster in order to gain insights into the performance and health of your applications. It is about keeping a check on the performance and resource utilization of a Kubernetes cluster and its associated components, including the nodes, pods, and containers. Kubernetes monitoring aims to ensure the stability and reliability of the applications running in the cluster, detect and resolve performance issues, and identify potential security risks.
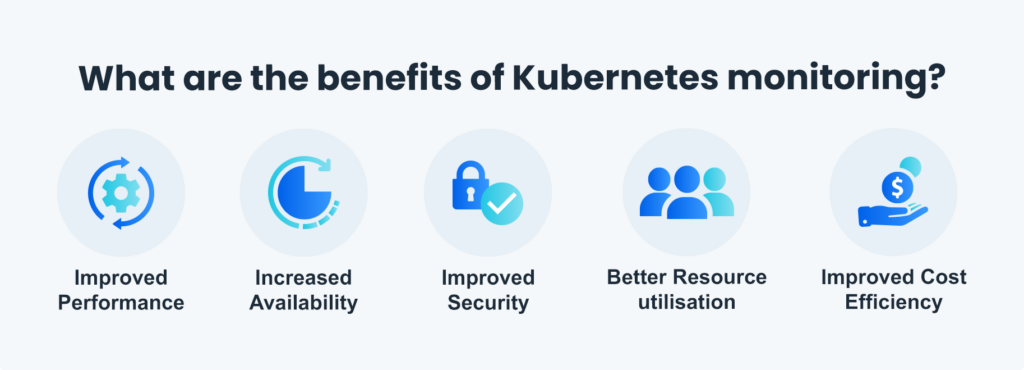
Kubernetes monitoring is an essential part of the container orchestration process. It helps you to gain visibility into the performance of your applications and identify issues before they become a problem. Kubernetes monitoring tools provide in-depth insights into the performance and health of your applications, enabling you to identify and address potential issues quickly.
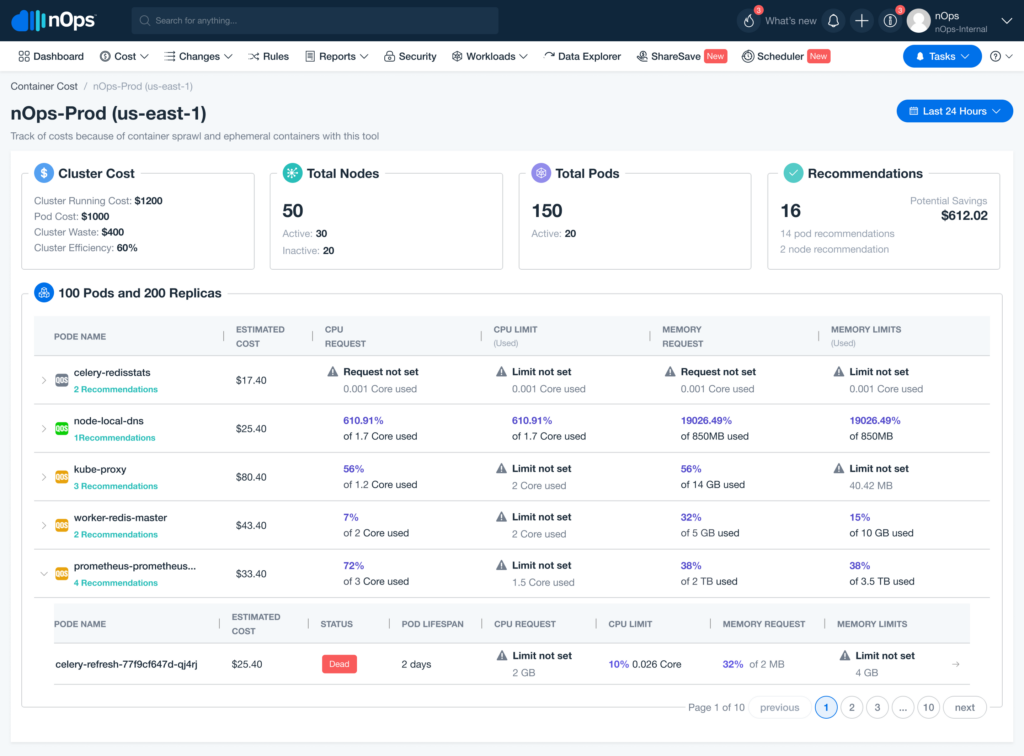
The majority of Kubernetes monitoring tools struggle to provide costs in a precise, clear, and useful manner. But, you can view your costs as cost per cluster, cost per pod, and cost per category down to the hour with nOps Kubernetes cost intelligence methodology. All of your cloud spending is consolidated into one platform by nOps.
When your workloads use both containerized and traditional services, you’ll see how much it costs to run a microservice, provide customer support, deliver a product, and more. You can view each service and how many CPU and memory resources it consumes to understand the financial implication of each service that has been created in the Kubernetes cluster.
Prometheus is an open-source monitoring system that provides real-time monitoring and alerting for Kubernetes clusters. It is widely used for monitoring and alerting on cloud-native applications and has become a popular choice for Kubernetes monitoring due to its features and ease of integration with the platform.
Grafana is an open-source platform for data visualization and monitoring that is widely used in combination with Prometheus for Kubernetes monitoring. Grafana provides a visual representation of the metrics collected by Prometheus and makes it easier for organizations to monitor and manage the health and performance of their Kubernetes clusters.
Kubewatch is a Kubernetes event watcher that provides real-time event-based monitoring for Kubernetes clusters. It is designed to work with Kubernetes APIs to provide visibility into changes in the cluster, including updates to deployments, pods, and nodes. Kubewatch listens for events generated by the Kubernetes API and sends notifications to administrators when changes occur in the cluster. This allows administrators to be aware of changes in real time and respond quickly to any potential issues.
Datadog is a cloud-based monitoring and analytics platform that provides comprehensive monitoring for Kubernetes clusters. It integrates with Kubernetes APIs to collect and visualize metrics and events, making it easier for organizations to monitor and manage their Kubernetes environment. Datadog collects a wide range of metrics from the Kubernetes cluster, including resource utilization, application performance, and more. These metrics are aggregated and analyzed in real-time to provide a complete view of the cluster’s performance.
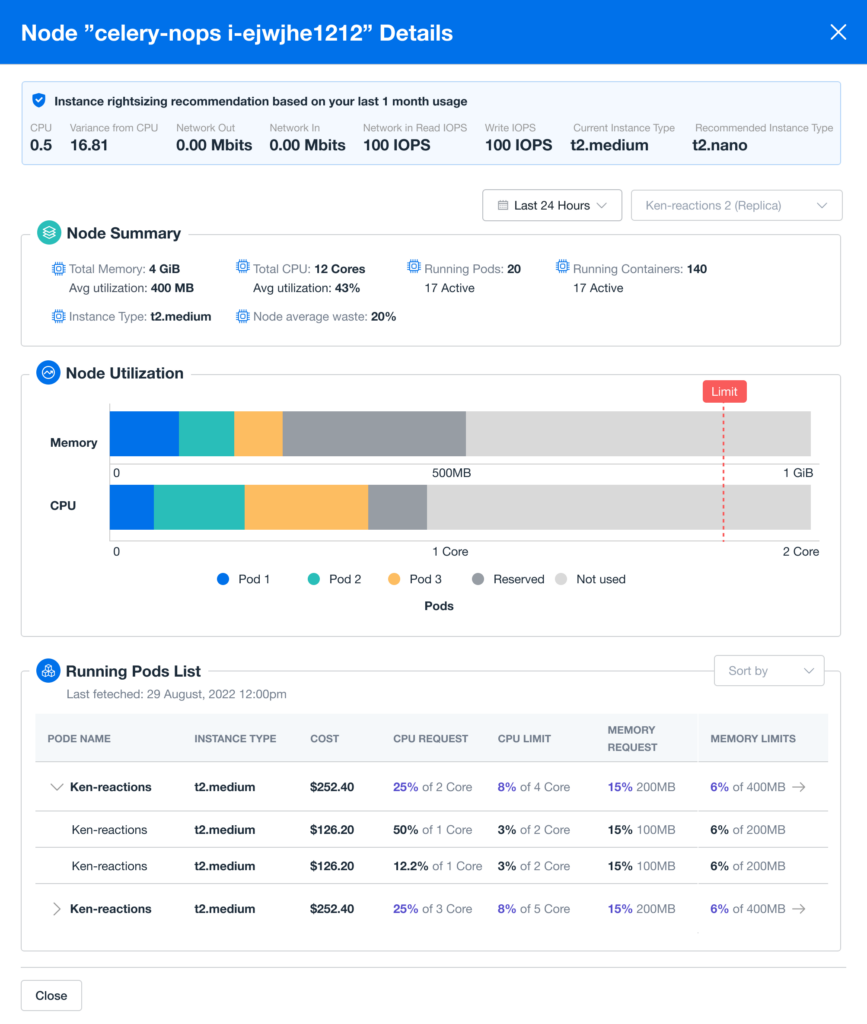
The one thing that always haunts the engineering teams is the cloud costs that incur by using these platforms. The nOps Kubernetes Cost Allocation & Optimization Solution assists in constantly locating and diminishing inessential expenses. Additionally, nOps has improved the nOps dashboard, allowing users to give greater bits of knowledge into their Kubernetes executions by demonstrating the expense of each asset inside a Kubernetes bunch. Such knowledge can enable you to settle on better choices for streamlining application assets to diminish the expense of running your workloads.
nOps also offers automated cost-saving actions, such as turning off idle resources and integration with Kubernetes providers such as AWS EKS, which allows for better visibility and control over your Kubernetes resources and cost. By using nOps for Kubernetes cost optimization, organizations can improve their overall cloud infrastructure efficiency, reduce their cloud spending, and ensure that their Kubernetes resources are being used efficiently. Sign up for nOps today. With nOps, you don’t pay unless we are saving you money.
Last Updated: January 1, 2025, EKS Optimization
Last Updated: January 1, 2025, EKS Optimization
AI-powered rate optimization with risk-free guarantee