
It took me far too long to get Proxmox up and running in my home lab, but now that everything is running smoothly, my focus has shifted to mapping, documenting, monitoring, and adding redundancies to ensure minimal downtime. Proxmox itself offers many features to aid with this. The web UI is absolutely awesome to use, and you can easily configure remote access for managing the home lab while away, but I wanted to use a few tools to take this a step further, bolstering on more protections with Proxmox's backups, snapshots, and other useful functionality.
Using free tools, I managed to map, monitor, and configure my home lab to automatically heal itself. That sounds like quite the achievement, but it was easier to configure than I initially assumed. The goal was to have my entire home lab running like a production environment and not some PC cases inside a data cabinet. Without overcomplicating things (which is the worst thing to do with a home lab), I wanted to map what actually existed in my home lab and on the LAN. I then wanted to configure some monitoring to check that everything is running.
Finally, I wanted my home lab to be resilient, but not so much as to automatically relaunch services, but to be able to recover from the most common failures without requiring human intervention. I managed to achieve all this in a few hours and with some well-documented tools.
The home lab grew large enough
I needed some help keeping tabs on everything
The LAN expanded from just a single switch and fiber link to the outside world to multiple switches, trunking, and access points. I have multiple areas to cover. Throw in network-attached storage (NAS), a custom OPNSense firewall, some LXCs and VMs on Proxmox nodes, and the need to keep all running services online, and I suddenly found myself needing more checks and balances in place. The home lab went from a small hobby on the side to run some cool apps to becoming an integral part of the home. Home Assistant alone is a perfect example of this.
To begin with, I mapped out my entire network. OPNsense was fine for listing all DHCP clients, but I wanted an easier and more thorough scan, which led me to Nmap. This utility is absolutely brilliant. There's also Zenmap, which is a GUI version that can be used to achieve simialr results. Using either tool allowed me to sweep the entire network in seconds, discovering everything on the LAN. I didn't want fancy diagrams or a visual representation of the network, so Netbox was out of the question. It's far too overkill for my needs anyway, but it's definitely worth checking out if you want the best.
The ultimate Promxox home lab monitor
Trivia challenge
Think you know your dashboards from your data sources? Test your home lab monitoring skills now.
In Proxmox VE, what is the minimum number of nodes required to form a supported High Availability cluster?
What is the default port that Prometheus uses to expose its own metrics and web UI?
Which Grafana feature allows you to send notifications to Slack or email when a metric crosses a defined threshold?
Which Prometheus exporter is most commonly used to collect hardware and OS-level metrics from Proxmox nodes, such as CPU usage and memory?
In Proxmox HA, what happens to a virtual machine when the node it runs on becomes unavailable?
In Prometheus, what is the term for the time-series data collection process where Prometheus contacts each target to retrieve metrics?
What is the name of the query language used natively by Prometheus and supported as a data source in Grafana?
Which pre-built Grafana dashboard ID on Grafana.com is widely used in the community to visualize Proxmox node metrics collected via Node Exporter?
Your Score
Thanks for playing!
For my setup, I'm going with Gitea, a self-hosted git platform. I've got a label maker and wanted to use QR codes and printed data to show what each device does, with the ability to scan the QR code on a phone to quickly bring up the Gitea MD file for that network client. It's also great for inventory, so I could kill all birds with a single self-hosted stone. Nmap and Zenmap were used to collate everything. nmap -sV -O -oX scan_results.xml 10.0.0.0/24 (swap 10.0.0.0 for your network range) provided ample data for Gitea to be populated, and the -oX flag exported all the data into an XML file. This was invaluable.
I mapped every machine in my home lab with this free tool
Capable of documenting even the most complex server setups and network stacks, NetBox is a must-have for any home labber
Moving everything to Gitea
Within Gitea, I created a home lab and network repository. This would be used to show all the relevant data for the entire network stack and home lab hardware. All services would have their own MD file with everything required to know precisely what to do when a failure occurs, and all required details for connecting and administering self-hosted content. And because Gitea is bonkers when it comes to self-hosting a git platform, full account access is required for anything to be readable, adding a security layer for those who fancy themselves black hat hackers through scanning the QR codes.
The README.md file acts as a sort of network dashboard, which then links out to various subfolders within the repo. I've got everything categorized in /servers, /smart-home, /network, and /storage. The last isn't relating to NAS and other storage devices, but rather inventory for anything that's stashed away in the garage. Gone are the days when I'd think, "Do I still have that old kit of DDR4 RAM now valued as much as my home?" and I can quickly check Gitea to see where it is or which device has it installed. I've inventoried everything, including all parts in all systems.
Remember those QR codes and the printer? Well, I've even stacked the codes and created small scannable labels that are now stuck to all my components. Quickly scanning that particular device will bring up an MD file with all the details. One could argue this as overkill, much like Netbox on a home network, but I find it liberating to finally understand how everything comes together, not just on the surface, but within each chassis. I can look at my Proxmox nodes and know precisely what's inside each system.
A $40 label maker and QR codes completely changed how I manage my home lab
Keeping tabs on everything within my home lab.
Monitor the entire stack, not just apps
Making sure every service, system, and app is running
Proxmox already does a great job at presenting data for all the nodes within the cluster and datacenter, but there's a way to improve this by including all running services, VMs, and more. My esteemed colleague Adam Conway wrote a fantastic guide on using Grafana, Loki, Prometheus, and Alloy to create the ultimate home lab dashboard, and it's one I used as the foundation for my own solution. In short, Prometheus scrapes the Proxmox stack and provides all the necessary data, which can then be used to present everything within a self-contained dashboard.
It quite literally takes five minutes and involves running just two virtual instances to bring everything together. Compared to using something like Homepage and logging into Proxmox to check system status, I can use Grafana to view everything within the home lab. There's even a way to pull this into Home Assistant to create the ultimate smart home platform that allows me to glance at anything relating to the home, network, or home lab in one location. I'm talking CPU by host, RAM usage, ZFS pool space, failed systemd units, network errors, uptime, and more.
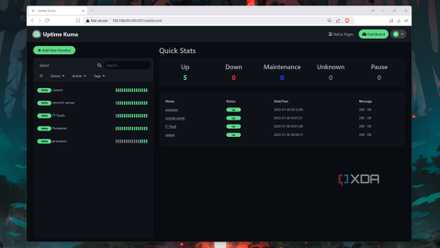
But as well as making sure the underlying instances and hardware are all up and running, I needed a way to check that a service is accessible. I opted to use Uptime Kuma with a remote system to check external connections at home. This is two-fold. First, it ensures reverse proxies are still working, certificates are live, and connections are possible. But it can also alert me to when individual services go offline, so I can quickly check them even if Grafana and the local shell report everything is well.
Re-rolling the homelab as a Cleric
Without an LLM running in the background
Making the home lab more resilient to failure doesn't mean I've connected a locally-hosted LLM to the entire stack. It's about ensuring that, should a systemd service fail for some reason, it's automatically restarted once. If a container on one of the Proxmox nodes stops, it's restarted. If a VM goes offline and doesn't reboot but is marked as required in my setup, a start command is sent through. It's nothing exciting, nor is it groundbreaking, but that's precisely the point. I want my home lab to be responsive ... to a point.
Save on Storage & Networking deals for your home lab
Proxmox powers my home lab, so I've got Proxmox High Availability (HA) at the ready. This handy tool can restart or even relocate HA-managed guests if a node fails. Instead of shrugging its shoulders and waiting for me to log in and fix something, Proxmox HA can automatically reset a node if a watchdog timer expires. It's actually really cool once you've configured the cluster to be self-sufficient to a degree. Not everything is covered by HA, but specific instances (Home Assistant, monitoring, etc.) that warrant it are better protected.
Coupled with Proxmox HA is Ansible, which can be invaluable for restarting systemd units, restarting failed Docker services, and even updating entire systems. It's really neat and worth exploring if you're serious about the home lab. Combining all of this, I've completely transformed my network and home lab from a fragmented mess of sorts to a cohesive, semi-automated Factorio mega-complex. The best part? It's actually easier to manage and allows me to focus on everything else in life, like experimenting with ways to break it all apart.
5 of the best tools for monitoring your home lab
Keep a weather eye on your home server with these incredible services