 |
VOOZH | about |
|
VOOZH | about |
Making sense of large data can be time-consuming and difficult. However, data visualization using graphs, charts, maps, etc., is one of the most effective ways to make sense of a large data set.
👁 D3.js LogoBut what is data visualization, you asked?
Data visualization is the practice of presenting large data sets and metrics into charts, graphs, and other visuals that allows for easy overview and analysis.
Many tools allow you to visualize data at different levels, but in this article, we’ll be exploring D3.js, a powerful JavaScript library that allows developers to create and present easily digestible, appealing, and interactive data visualization experiences.
The Replay is a weekly newsletter for dev and engineering leaders.
Delivered once a week, it's your curated guide to the most important conversations around frontend dev, emerging AI tools, and the state of modern software.
You’ll need to have Node.js installed to follow along. You can download it from the official website.
Run the following command to install the dependencies we’ll need to set up a basic Node application with Express and Handlebars:
npm install express express-handlebars nodemon
Or, add the following object to your package.json file and run npm install on your terminal.
{
 "express": "^4.17.1",
 "express-handlebars": "^6.0.2",
 "nodemon": "^2.0.15"
}
Create your development directory to look like the one below:
.
├── package-lock.json
├── package.json
├── public
│ └── static
│ ├── css
│ │ └── index.css
│ └── js
│ ├── index.js
├── readme.md
├── server.js
└── views
 ├── home.handlebars
 └── layouts
 └── main.handlebars
Add a simple Node server with Express server code to the server.js file.
const express = require('express');
const { engine } = require('express-handlebars');
const app = express();
app.use(express.static('public'));
app.engine('handlebars', engine());
app.set('view engine', 'handlebars');
app.set('views', './views');

app.get('/', (req, res) => {
 res.render('home');
});
app.get('/api/data', (req, res) => {
 const data = [100, 50, 300, 40, 350, 250]; // assuming this is coming from the database
 res.json(data);
});

app.listen(3000);
In the above code, we have an API route (/api/data) and a home route (/). The API route will talk to a database and return the data we need to visualize in the home route.
In the frontend, we’ll use D3 to visualize the data. We’ll create a bar chart with the data we get from the API. Assuming the data from the API is the grades of some high school students, we’ll create a visualization in order to see an overview of the student’s result pattern.
Add the following HTML code to your handlebars template:
/view/home.handlebars
<!DOCTYPE html>
<html lang="en">
<head>
 <meta charset="UTF-8">
 <meta http-equiv="X-UA-Compatible" content="IE=edge">
 <meta name="viewport" content="width=device-width, initial-scale=1.0">
 <title>D3 Bar Chart</title>
</head>
<body>
 <h2> D3 Bar Chart</h2>
 <svg class="bar-chart"></svg>
</body>
</html>

<script type="module" src="./static/js/index.js"></script>
Notice we added an SVG element and a class class="bar-chart" to it, as we’ll load the chart as an SVG. Let’s now use D3 to create the bar chart.
Note: There are many visualizations you can create with D3 beyond charting. You could visualize data with maps, graphs, word clouds, and heat maps, for example.
Below is the JavaScript code for the frontend. Here is where we’ll use D3 to create the bar chart:
/public/static/index.js
import * as d3 from "https://cdn.skypack.dev/d3@7";
import axios from 'https://cdn.skypack.dev/axios';

const dataSet = async function getData() {
 return await axios.get('/api/data');
}
async function drawChart() {
 const data = await dataSet();
 const svgWidth = 500;
 const svgHeight = 500;
 const barPadding = 5;
 const barWidth = svgWidth / data.data.length;

 let svg = d3.select("svg");
 let width = svg
 .attr("width", svgWidth)
 .attr("height", svgHeight);

 svg
 .selectAll("rect")
 .data(data.data)
 .enter()
 .append("rect")
 .attr("y", (d) => svgHeight - d)
 .attr("height", (d) => d)
 .attr("width", () => barWidth - barPadding)
 .attr("transform", (d, i) => {
 let translate = [barWidth * i, 0];
 return `translate(${translate})`;
 })
 .style("fill", "steelblue");
}
drawChart();
We’ll use the getData function to get the data from the API with a simple Axios get request, as shown below:
const dataSet = async function getData() {
 return await axios.get('/api/data');
}
In the drawChart function, we’ll first set the properties we need: get the data to present, the SVG height and width, and the parameters for the chart, such as padding and width.
 const data = await dataSet();
 const svgWidth = 500;
 const svgHeight = 500;
 const barPadding = 5;
 const barWidth = svgWidth / data.data.length;
Next, we’ll select the <svg> tag using the d3.select function, as shown below:
let svg = d3.select("svg");
This will allow us access to modify the SVG and to create the bar chart. So, let’s set the width of the SVG element.
 let width = svg
 .attr("width", svgWidth)
 .attr("height", svgHeight);
Then, select all rectangles in the SVG, even though there are none at this point. Next, we’ll add the data we’d like to visualize to the data chained function:
.data(data.data)
We’ll then use the enter function to iterate over the data to create the rectangles and append them to the SVG.
.enter()
For every iteration, the enter() function makes, a rectangle will eventually form the chart.
.append("rect")
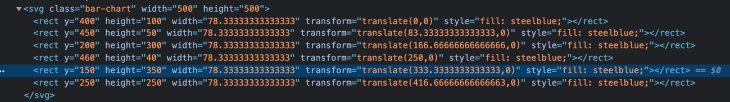
The resulting HTML should look like this now:
Next, set the height and width of each rectangle. The height of the rectangle will be based on the data, specifically the array items, while the width will be the width of the bar we’ve already set, minus the padding of the bar chart we’ve already set.
Also, we’ll need to set the Y-axis to the height of the SVG, minus the data item. Otherwise, our bars will look inverted:
 .attr("y", (d) => svgHeight - d)
 .attr("height", (d) => d)
 .attr("width", () => barWidth - barPadding)
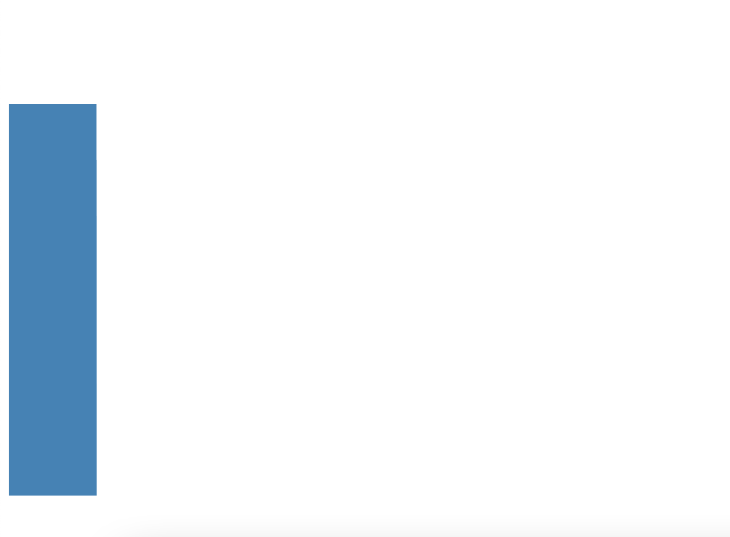
Finally, we’ll use the translate form of the transform property of an SVG to separate each of the rectangles visually. Otherwise, all the rectangles will be joined to one rectangle as shown below:
👁 One Long Rectangle Bar Graph
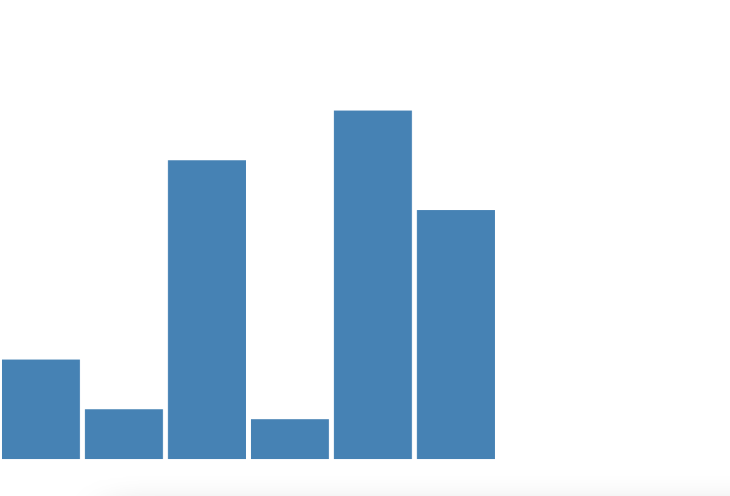
When we transform-translate, it will look like this:
👁 SVG With Transform Translate
.attr("transform", (d, i) => {
 let translate = [barWidth * i, 0];
 return `translate(${translate})`;
})
In the last part, we added style. You can add CSS styles to D3 using the .style property.
.style("fill", "steelblue");
Finally, this is how the chart looks:
Of course, more can still be done to improve this chart. You can create an even more complex data visualization experience with D3.
You should take a look at the documentation, as it provides many examples that you can directly edit so you can get a feel of how it works.
D3 is a powerful tool that enables you to create complex data visualizations beyond bar charts. You can check examples of what is possible in the D3 gallery.
We’ve only just scratched the surface. I look forward to what you would build with D3 and Node. Happy coding!
Deploying a Node-based web app or website is the easy part. Making sure your Node instance continues to serve resources to your app is where things get tougher. If you’re interested in ensuring requests to the backend or third-party services are successful, try LogRocket.
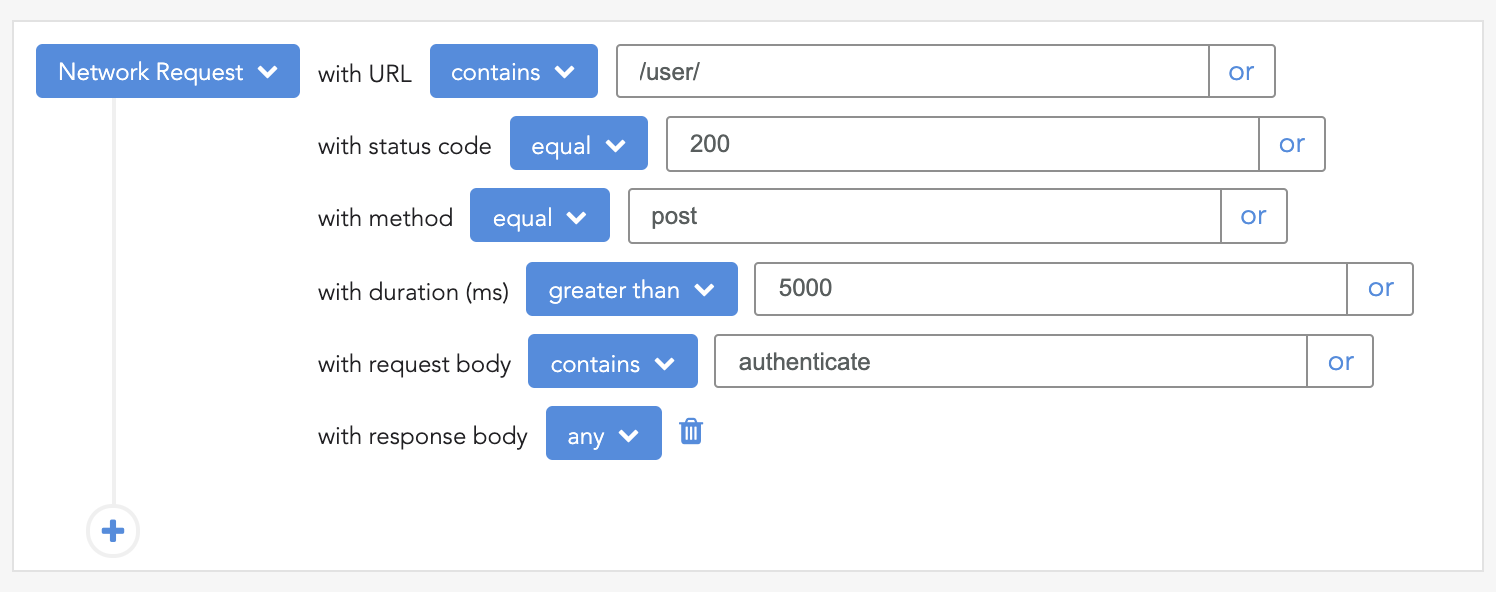
👁 LogRocket Network Request MonitoringLogRocket lets you replay user sessions, eliminating guesswork around why bugs happen by showing exactly what users experienced. It captures console logs, errors, network requests, and pixel-perfect DOM recordings — compatible with all frameworks.
LogRocket's Galileo AI watches sessions for you, instantly identifying and explaining user struggles with automated monitoring of your entire product experience.
LogRocket instruments your app to record baseline performance timings such as page load time, time to first byte, slow network requests, and also logs Redux, NgRx, and Vuex actions/state. Start monitoring for free.
Learn how next-browser gives AI agents runtime context for debugging Next.js apps, including React props, hydration, PPR, forms, and performance.
Build dynamic LLM routing in Next.js with OpenRouter, TanStack AI, task classification, model fallbacks, and cost-aware routing.
TSRX adds first-class control flow, conditional hooks, and scoped styles to React via a TypeScript compiler extension — no new framework required.
Learn how to build a full React Native auth system using Better Auth and Expo — with email/password login, Google OAuth, session persistence, and protected routes.
Would you be interested in joining LogRocket's developer community?
Join LogRocket’s Content Advisory Board. You’ll help inform the type of content we create and get access to exclusive meetups, social accreditation, and swag.
Sign up now