 |
VOOZH | about |
|
VOOZH | about |
I have to admit that I don’t typically set up a debugger unless it is easy to use. I have been a developer for almost two decades now, and back when I started, it was never easy.
👁 React Native and Flipper Logos Over a Blue Water BackgroundI was able to get debuggers for different languages working once or twice but gave up whenever something went wrong, and, for the most part, haven’t used any debuggers until recently. I mostly worked in JavaScript and could make do with console.log. It worked well enough and I didn’t have to go down a rabbit hole of configuring things.
But then I learned about Flipper, one of the best debuggers I have used for any technology.
The Replay is a weekly newsletter for dev and engineering leaders.
Delivered once a week, it's your curated guide to the most important conversations around frontend dev, emerging AI tools, and the state of modern software.
You can do some debugging in React Native only using console.log, but there are times when that is just not enough.
You can constantly log your Redux state to the console when it updates, but those results are much harder to look at than a nice table that lists all the updates and a breakdown of the changes you can click through.
You can also figure out how to log every part of your network call, or you can just use Flipper and see why you are getting a 403 error right away.
But Flipper can do much more than that. It has a plugin system for adding specialized debugging. This article will walk you through how to debug React Native using Flipper.
Installing the desktop app is easy. You can find installation files for Windows, Mac, or Linux here.
Depending on your operating system, you will also need to have the Android and the iOS development tools installed, which only makes sense because, otherwise, why would you install Flipper? You will also need to have OpenSSL installed.
I spotted Flipper earlier when a project I was working on used an older version of React Native, but I didn’t want to investigate setting it up manually on both iOS and Android.
Fortunately, it now works in React Native as long as you are using version 0.62 or higher. To start using Flipper in a new React Native app, install the Flipper desktop app, start Flipper, and run your project.
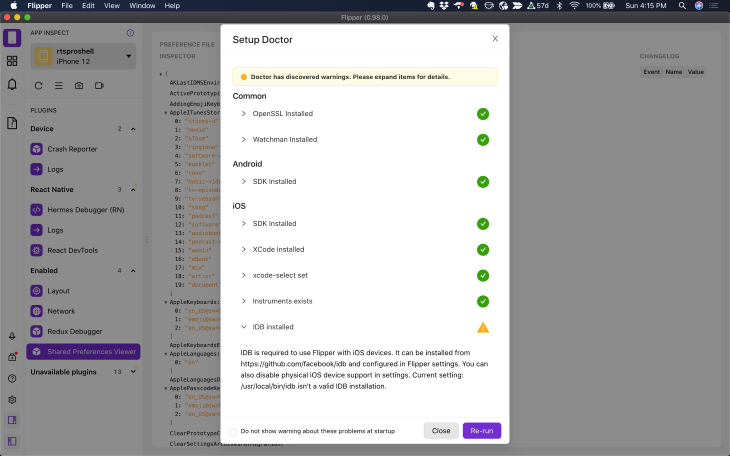
Once you have installed Flipper, click the Setup Doctor button on the left menu to ensure you have all the dependencies installed. If you are missing anything, Flipper will tell you how to fix the issue.
You can also manually add Flipper to a React Native Android app, a React Native iOS app, a native Android app, or a native iOS app.
Out of the box, Flipper comes with more than what you would expect from a standard debugger. It puts everything you want to know about the state of your project in one place.
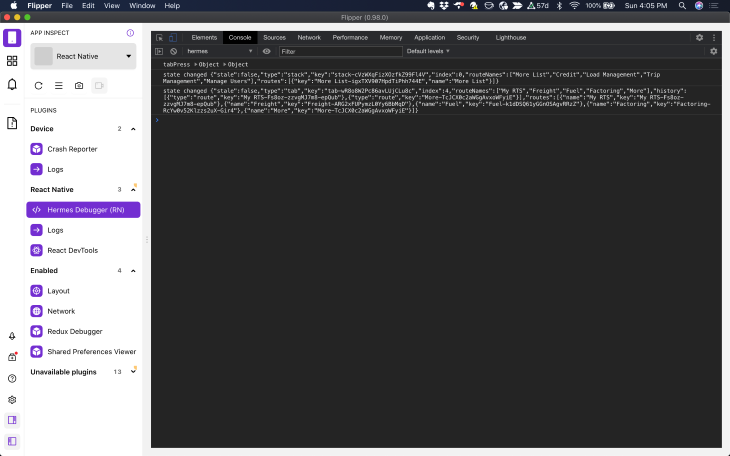
You can debug just as easily in Flipper as you can in Chrome by clicking the Hermes Debugger menu. You can use console.log — like I did below — if you want to. It works well in a pinch.
If you develop in React Native, you likely know you have to debug issues in multiple places, including natively. Sometimes the app crashes and the React Native logs don’t help much.
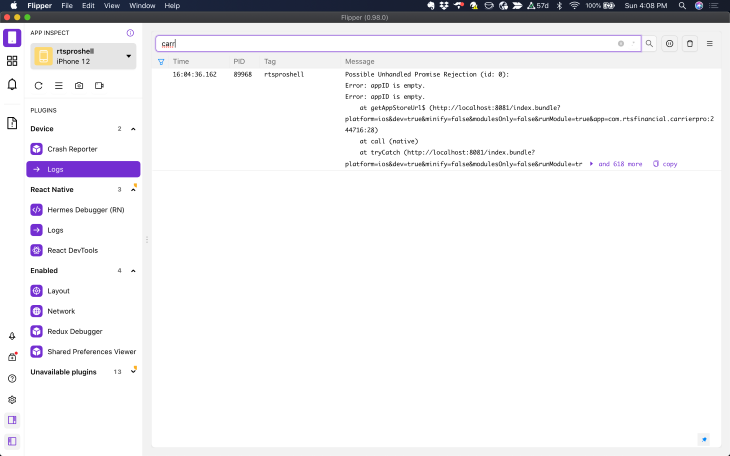
Flipper provides access to the native logs under the Device section of the left menu. It helps to know what you are looking for when you view the logs, so you can use the filter field at the top to narrow down the results.
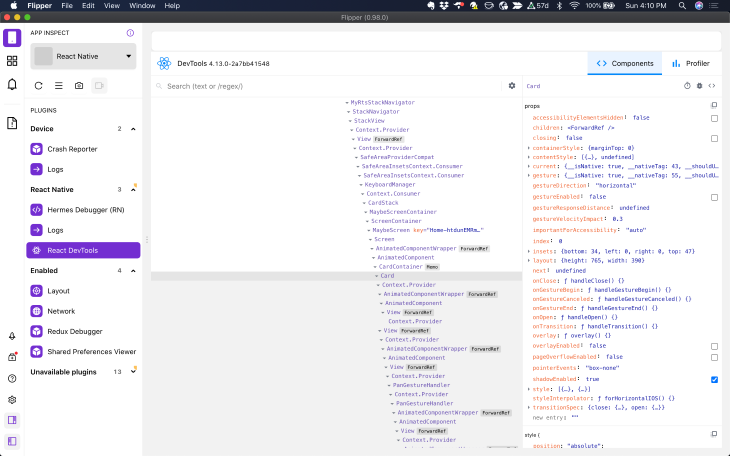
When I started developing in React Native, I missed being able to use React DevTools. It’s easy to overlook errors in your component props in your code, and this tool will tell you exactly what is happening. It is also helpful for finding undocumented props in third-party components.
This tool helped me track down why a splash screen was stuck. A network call failed and prevented the app from going to the dashboard screen.
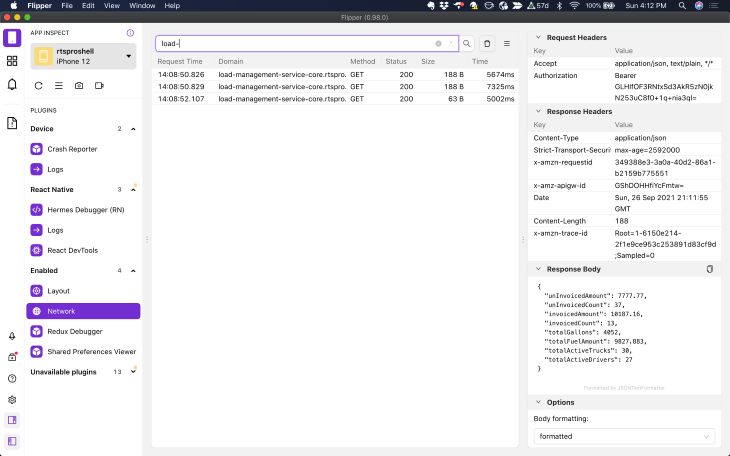
If you debug through Chrome, you can’t see the app’s network calls without adding some code to the project. All you can see is the internet network calls for the fonts and images. And, to be able to debug app network calls through Chrome, I had to add this code to the App.tsx file:
global.XMLHttpRequest = global.originalXMLHttpRequest || global.XMLHttpRequest;
With Flipper, I don’t have to worry about that anymore:
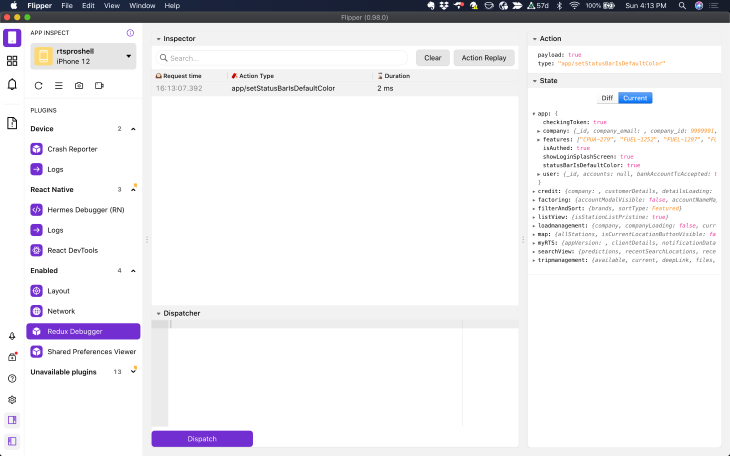
Redux is great until you have a typo somewhere and can’t spot it in your code. Sometimes console.log works for debugging Redux, but it’s not easy. You usually have to log in multiple places to figure out what is going on.
That’s when you start wondering why you need Redux. But having a Redux debugger that logs all of the actions and shows you state before and after updates can keep you from chasing your data around the app with console.logs.
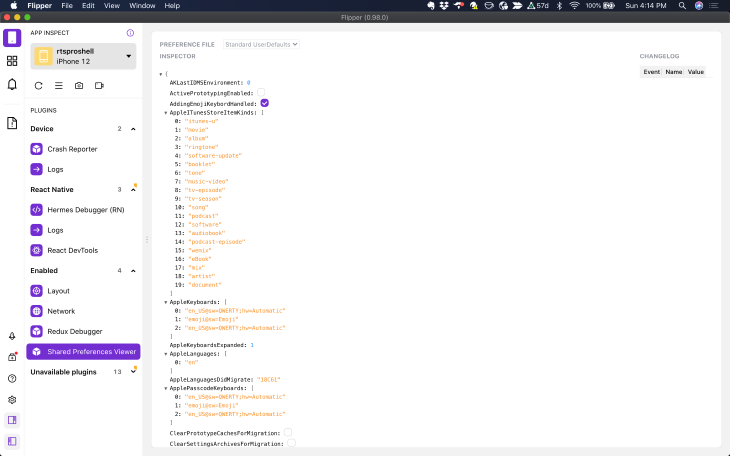
This screen will help you determine what is going on in shared preferences, i.e., if your app is logging users out every time it closes.
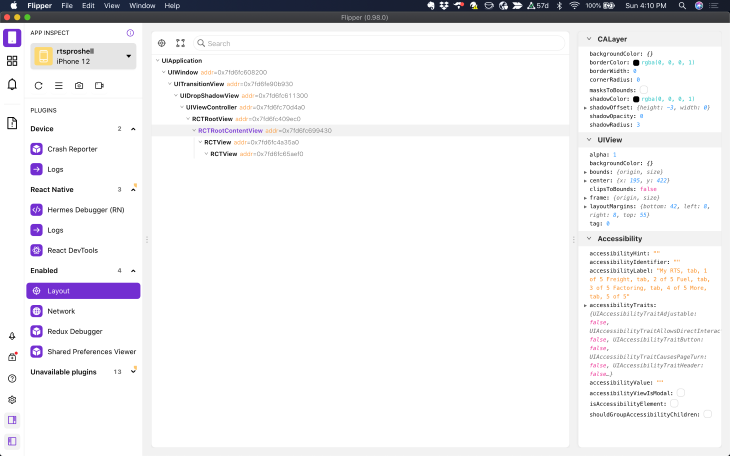
This inspector lets you see what is happening in your native layouts. It also supports some third-party React Native components like Litho and ComponentKit.
Flipper allows you to control other things with the buttons on the left sidebar and underneath the device selector. With it, you can:
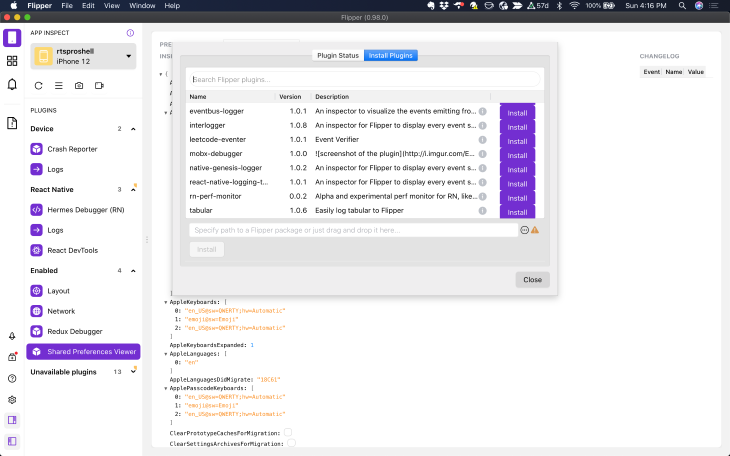
This is the feature that separates Flipper from other debugging tools: Flipper is extensible. You can get to the plugin menu by clicking on the second tab down on the left, the one with the squares.
If you click on the install menu, it will take a while for the available plugins to show up. It doesn’t have a loading indicator, so just be patient and they will eventually show. From there, you can install plugins with a click of a button or select the local plugin path from the form on the bottom.
Here are some of the plugins currently available.
You can also create your own plugins and contribute them to the community.
It has been a while since I used breakpoints to debug JavaScript because console.log does the job just fine. React Native is a different animal and breakpoints are nice there, so let’s look at how to use them.
The first thing you need to know is that you have to be using Hermes in your React Native project to use breakpoints, and you won’t figure this out by yourself until you wade through half a dozen issue threads.
But, for the most part, it’s easy to enable Hermes in your project. It will make your React Native app run faster, especially on Android. I did run into one issue with a package I was using, but updating to the latest version fixed the problem. Most of the other issues I ran into involving Hermes were caused by issues with third-party packages.
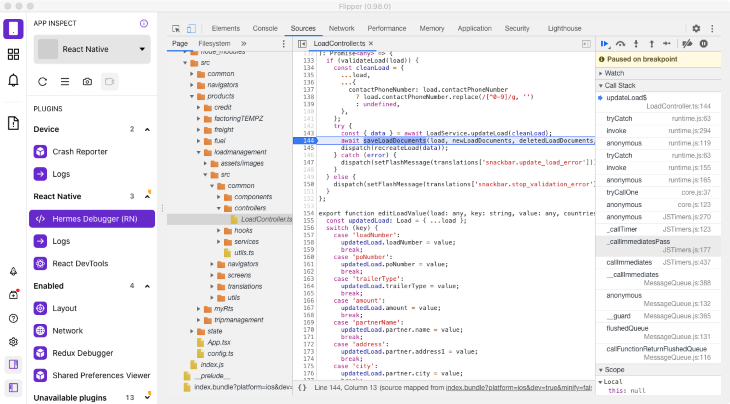
With Hermes enabled, select the Hermes Debugger (RN) section, which will load an instance of Chrome developer tools. Select the Sources tab, where you will find the files in your project in the left sidebar under Pages. They should be under the localhost:8081 folder.
Then, select the file you are working on and click left of the line number you want the breakpoint on, and run your app to that point.
In this example, I was trying to figure out why I was getting a 401 from an endpoint. I found out right away that I wasn’t using await when getting the token from shared preferences. I knew the token was correct because I could go to the Shared Preferences Viewer in Flipper and check it:
👁 Shared Preferences Viewer in Flipper
There is no reason not to use Flipper if you are developing apps in React Native. All you need to do is download Flipper, install it, then run it. I, too, thought console.log was enough, but now I wish I had Flipper available for all of my projects that don’t use React Native.
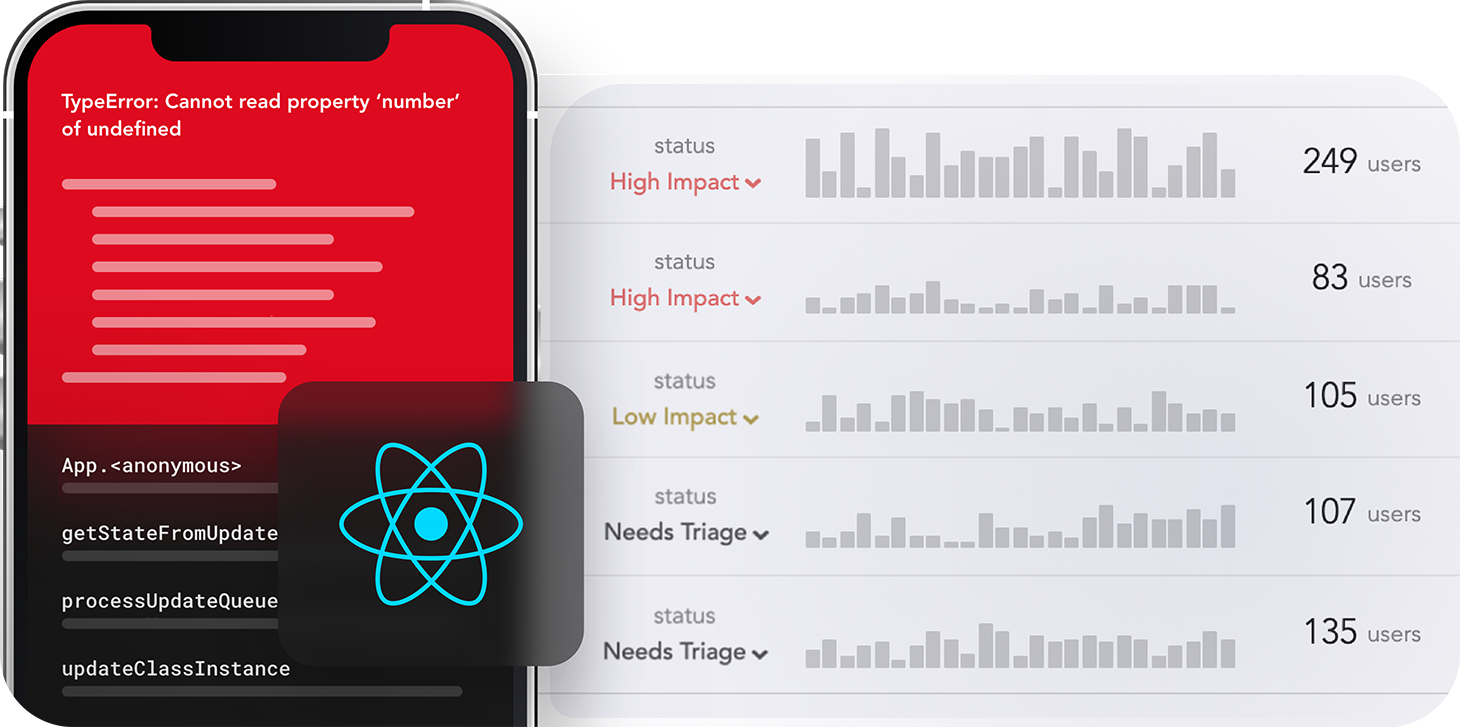
LogRocket's Galileo AI watches sessions for you and and surfaces the technical and usability issues holding back your React Native apps.
LogRocket also helps you increase conversion rates and product usage by showing you exactly how users are interacting with your app. LogRocket's product analytics features surface the reasons why users don't complete a particular flow or don't adopt a new feature.
Start proactively monitoring your React Native apps — try LogRocket for free.
Learn how next-browser gives AI agents runtime context for debugging Next.js apps, including React props, hydration, PPR, forms, and performance.
Build dynamic LLM routing in Next.js with OpenRouter, TanStack AI, task classification, model fallbacks, and cost-aware routing.
TSRX adds first-class control flow, conditional hooks, and scoped styles to React via a TypeScript compiler extension — no new framework required.
Learn how to build a full React Native auth system using Better Auth and Expo — with email/password login, Google OAuth, session persistence, and protected routes.
Hey there, want to help make our blog better?
Join LogRocket’s Content Advisory Board. You’ll help inform the type of content we create and get access to exclusive meetups, social accreditation, and swag.
Sign up now