 |
VOOZH | about |
|
VOOZH | about |
When I developed native Android apps, I never had to set up debugging. It just worked in Android Studio. When I moved to React Native, though, I used console.log to debug my apps most of the time. But I missed the type of debugging I could do in Android Studio. I discovered, however, that I could use VS Code.
There are several ways to debug a React Native app, including using Google Chrome, Flipper, or React Native Debugger, but it’s nice to have the same Android Studio or XCode experience where you can write code and debug in the same app.
In this article, we’ll do just that by debugging a React Native app using VS Code.
The Replay is a weekly newsletter for dev and engineering leaders.
Delivered once a week, it's your curated guide to the most important conversations around frontend dev, emerging AI tools, and the state of modern software.
First, make sure you have a few things ready. Have VS Code installed, set up your React Native development environment set up, and have a project you want to debug.
To check that your development environment is set up correctly, you can run the following command in your project folder:
npx react-native doctor
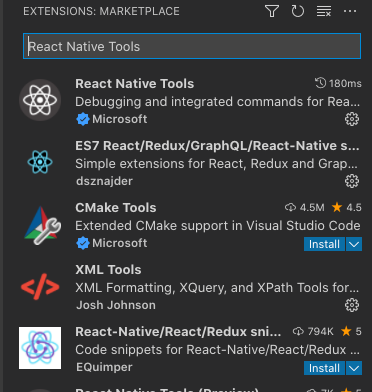
The next step is to install the React Native Tools extension in VS Code. Open up VS Code and your React Native project and search the extensions for “React Native Tools.” Make sure you see the Microsoft name on the extension.
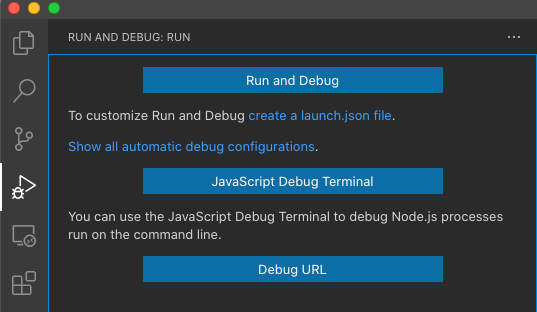
Next, you need to create a debug configuration for VS code. Click on the Run view in VS Code, and then click Create a launch.json file.
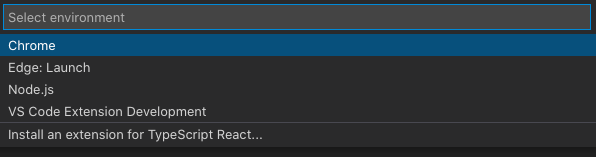
Choose any option that shows because we will paste over the contents of the file. You can also create the launch.json file manually in the .vscode folder of the project.
Now, paste this in the file:
{
 "version": "0.2.0",
 "configurations": []
}
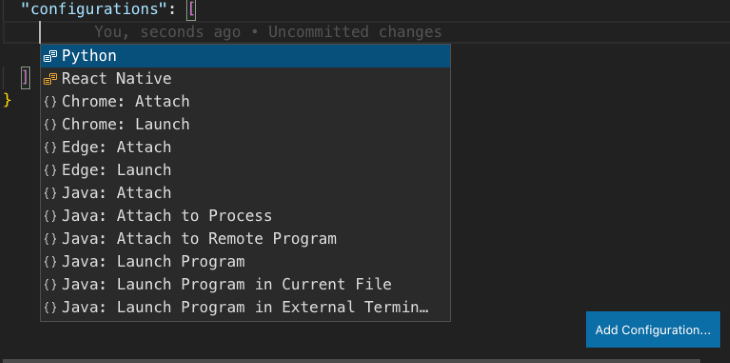
Click the Add Configuration button that shows up when you open the file, then click on React Native.
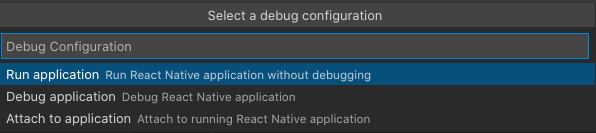
This will bring up another menu that will ask you what kind of debugging configuration you want to create. Choose Debug application.
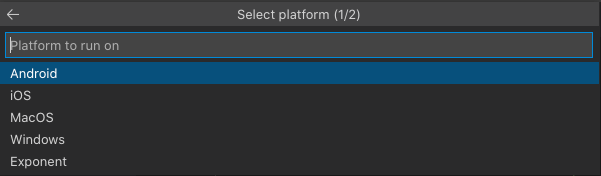
Next, it will ask you what platform you will create the debug configuration for. Choose iOS.
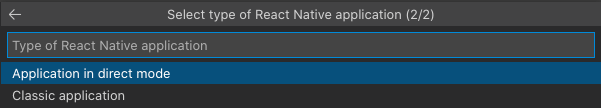
Next, you’ll be asked how you want to debug the application. We have two options:
The support for direct debugging in iOS is experimental. You can choose either, but if you are using Hermes in your app, you will want to choose Application in direct mode. In the next and final question asking if you are using Hermes, choose yes. You can also add both configurations to see which works out best.
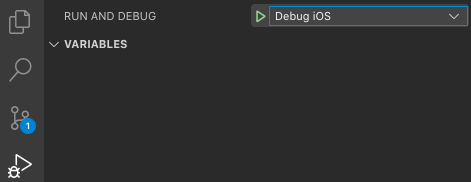
Let’s go to the Run view, where the drop-down menu at the top of the GUI will show your new debug configuration.
Clicking on the green triangle should start your app in the iOS simulator unless you created your app with create-react-native-app and are using Expo. If so, you may get a couple of error codes and nothing will run. We fix that down below.
Finally, open the developer menu once the app is running and enable remote debugging.
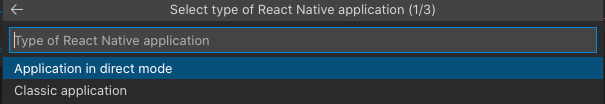
To create the debug configurations in Android is the same as it is for iOS, except you will choose Android from the platform options. You will have the option of choosing Application in direct mode and Classic application when you are selecting the type of React Native application.
In Android, direct mode can only be used with Hermes. If you are not using Hermes, choose Classic application. Again, enable remote debugging once the app is running.
If you are using Expo, nothing will work yet, and npx react-native doctor won’t help you find the issue. To fix this, choose Exponent in the platform options instead of Android or iOS.
Ensure you have expo-cli installed globally. If you don’t, run the following command in the terminal to install it:
npm install -g expo-cli
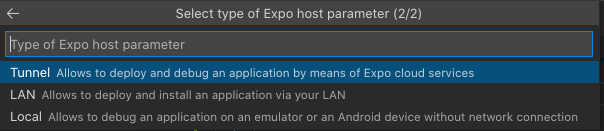
Now, choose the Expo host parameter you want to use. If you choose Tunnel, you’ll be asked to create an Expo account username and password if you haven’t done so already. You can choose LAN or Tunnel if you don’t want to create an account.
Once the packager starts, VS code will show you a QR code, which you can scan with the Expo app installed on your phone, either for Android or iOS, to run and debug the app on your phone remotely. You will also have to enable remote debugging on the phone once the app is running.
Although clicking the play button in VS Code makes running and debugging your app simple and easy, run your project the standard way by attaching the debugger to the running app instead. This way, you won’t have to go through all the steps above to customize the debug configuration for your app — and it will work most of the time.
To do this, follow the first step for creating a debug configuration for iOS above. Once the first menu comes up, select Attach to application.
Afterward, VS Code will ask you the type of React Native application you want to attach it to instead of asking which platform you are using. Choose Application in direct mode if you are using Hermes on either mobile platform or want to use direct mode in iOS, and Classic application if you are not.
If you choose Classic application, you will be asked to enter the address of the host, which will be auto-filled with localhost. You’ll then be asked to enter the port of the host, which will be auto-filled with 8081. If you are using the defaults for the packager, the auto-filled values will work, so just hit enter in each menu.
Now, you should have either Attach to Hermes application – Experimental or Attach to packager in VS Code’s Run and Debug drop-down menu, depending on which option you chose in the last menu.
You can launch your app either in Android or iOS with the standard commands you use. Once it is running, click the play button for that option to debug your app.
This works when you are having trouble launching an emulator or simulator with a debug configuration, too. Clicking one run button is convenient, but it may not be worth the trouble of figuring out the errors preventing the app from launching when attaching to a running instance will work just as well.
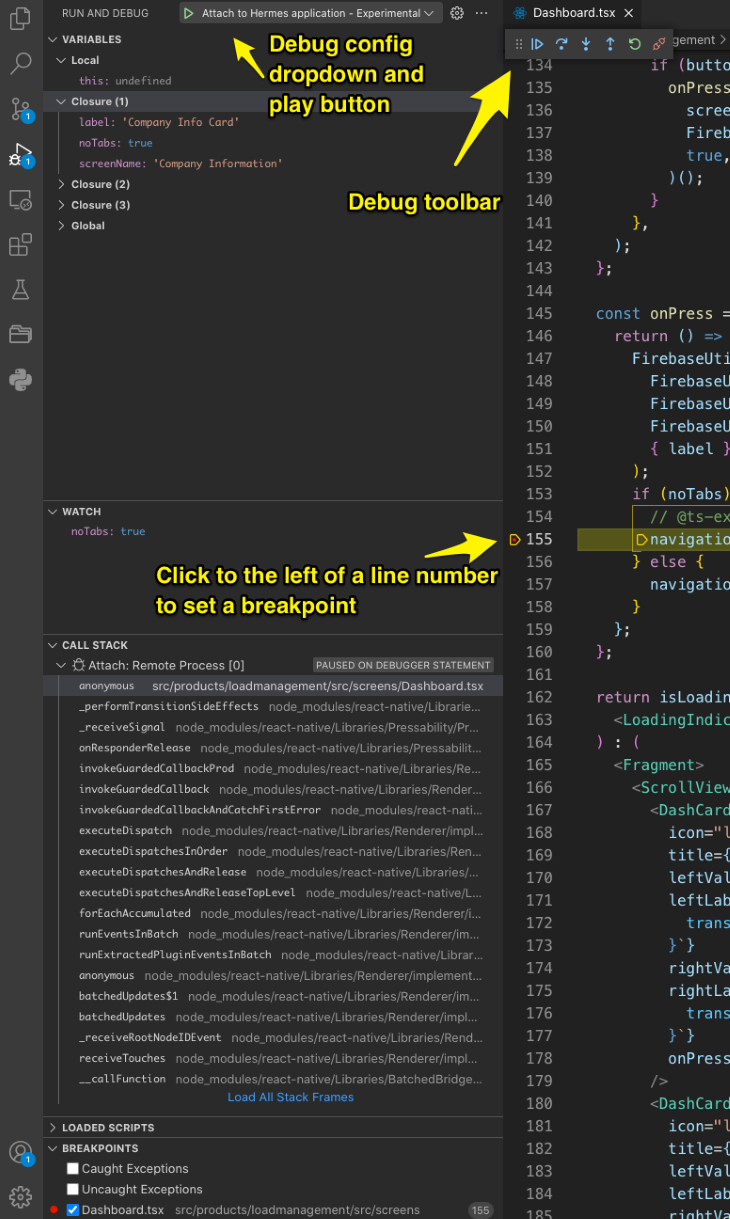
Now that you have all the debug configurations you need, either start the app with one or attach to a running instance of your app. Get familiar with the run and debug views, too. You can see mine with a breakpoint I set below:
Here, I put a breakpoint in a call to React Navigation because I wanted to ensure that a parameter was set correctly.
For example, one of the cards on the dashboard was taking users to the wrong navigation stack, so I clicked on the left of the line number in the code where the navigation occurred until a red dot showed. This sets a breakpoint. The breakpoint will then be listed in the Breakpoints section of the left panel.
I also wanted to watch the noTabs variable, which determined which navigation stack would be used. So, I added this variable to the Watch section. Then, I clicked through the app until the code was executed. Now I can see that the variable was set to true.
There is plenty of functionality in the debug view of VS Code. Becoming familiar with it will help you level up your debugging skills, especially if you have only used console.log up to this point.
Let’s review what we have in the left panel.
This lists all the debug and play configurations created in the launch.json file. Choose one and click play to run the configuration.
All the variables in scope when the application is paused on a breakpoint are listed here. They are divided by the closures that contain them, so you have to dig around to figure out which closure holds the variable you are looking for.
This section allows you to set variables you want to watch that could be in any one of the closures. This is handy if you know exactly which variable you want to check, so you don’t have to look through all the closures.
In this section, you can dig through the call stack. By clicking on one function in the stack, you can open the function in the editor.
This section lists all running scripts.
The breakpoints section lists all the breakpoints you have set in your code. You can activate and deactivate them here using the checkbox. There is also the option to check caught and uncaught expressions to break on every one of those types of exceptions, which is useful when you want to track down why an app is crashing.
The debug view has a floating debug toolbar that has a drag handle on the left, so you can put it anywhere in the editor panel. I have yet to find a place where it won’t eventually be in the way, though. It also has five buttons on it that do these things:
I only use the pause and stop buttons. The other three buttons are useful if you want to know what is going on around the breakpoint you set. Stepping through code with these buttons can take a while because, by default, it will take you through the Node modules folder and all the code that is executed there.
To prevent this, you can add skipFiles to your debug configuration. You can add an array of file paths you want the debugger to ignore. Here is an example I used in my Attach to packager debug configuration to skip the Node modules folder:
{
 "name": "Attach to packager",
 "request": "attach",
 "type": "reactnative",
 "cwd": "${workspaceFolder}",
 "skipFiles": [
 "node_modules/**",
 ],
}
If you use VS Code for React Native development, it only takes a few minutes to configure and start debugging your code. If you think console.log is enough, but haven’t tried a real debugger, you don’t know what you are missing! Thanks for reading.
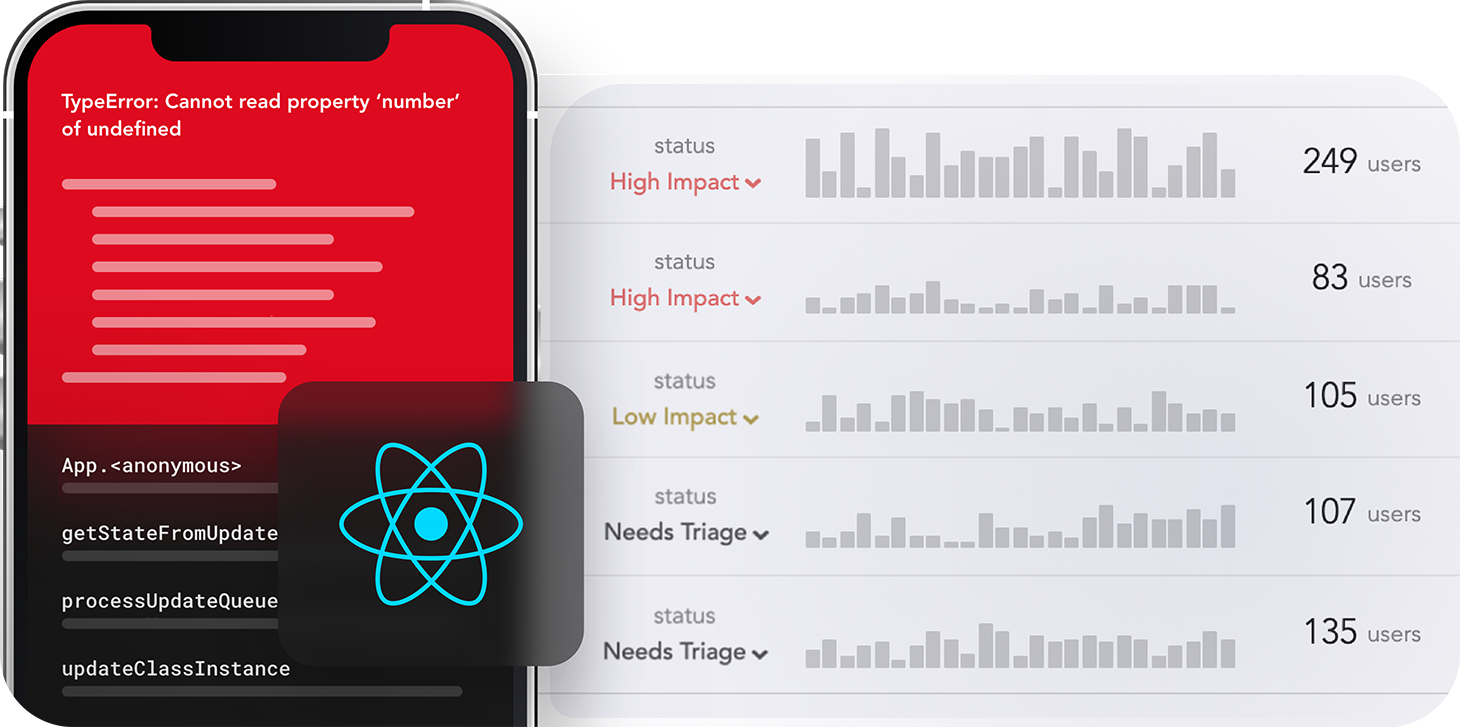
LogRocket's Galileo AI watches sessions for you and and surfaces the technical and usability issues holding back your React Native apps.
LogRocket also helps you increase conversion rates and product usage by showing you exactly how users are interacting with your app. LogRocket's product analytics features surface the reasons why users don't complete a particular flow or don't adopt a new feature.
Start proactively monitoring your React Native apps — try LogRocket for free.
TSRX adds first-class control flow, conditional hooks, and scoped styles to React via a TypeScript compiler extension — no new framework required.
Learn how to build a full React Native auth system using Better Auth and Expo — with email/password login, Google OAuth, session persistence, and protected routes.
Compare the top AI development tools and models of June 2026. View updated rankings, feature breakdowns, and find the best fit for you.
Learn how Bloom filters reduce database lookups for username availability checks while preserving correctness at scale.
Would you be interested in joining LogRocket's developer community?
Join LogRocket’s Content Advisory Board. You’ll help inform the type of content we create and get access to exclusive meetups, social accreditation, and swag.
Sign up now