 |
VOOZH | about |
|
VOOZH | about |
Editor’s note: This post on debugging Rust with VS Code was last updated on 6 March 2023 to include more information on when to use VS Code and more insight into alternatives to VS Code. To learn more about Rust, visit our archives here.
👁 How to Debug Rust With VS CodeRust continues to uphold its status as the most-loved programming language for its ease of use, safety, and high performance. With this popularity, many new developers are learning Rust for the first time.
One important task when setting up for Rust development locally is to choose a development environment, then set up that environment to do what you want it to. Many developers choose to debug their code in Visual Studio Code because it is free and feels snappy to use on most hardware.
Let’s see how we can get set up with Rust on Visual Studio Code for debugging! 🧑💻🚀
Jump ahead:
The Replay is a weekly newsletter for dev and engineering leaders.
Delivered once a week, it's your curated guide to the most important conversations around frontend dev, emerging AI tools, and the state of modern software.
Before we start to write our code, we have a serious question to answer, namely, what IDE should I use? Choosing an IDE is highly subjective, so nobody can really say that one tool is definitively better than the other (and, if they did, they’d probably get some readers writing fairly strong comments arguing why their particular choice is better than the given recommendation 😅). Instead of saying that one IDE is objectively better than another, let’s consider three good options that we can choose from.
Things to love: VS Code benefits from being available across a variety of platforms, so whether you’re coding on Linux, Windows, or macOS, you’ll always be able to develop and debug Rust.
The development experience is also first-class, as the Rust plugin for VS Code uses rust-analyzer within your Rust project as well. By itself, this means that you get excellent code hints and recommendations within VS Code itself.
It’s also the right price (free!) and performs well. If you compare using VS Code to another IDE like CLion, VS Code stands up surprisingly well. And, if you’re already developing software, there’s a good chance you already have it installed on your computer right now.
Things to think about: VS Code is a lot lighter than other IDEs, but this comes with the caveat that it is not really an IDE (it’s more of a fancy text editor) and doesn’t have many features found in other, more fully featured solutions. It also lacks simple functions that are important when working with bigger projects, like being able to tear off tabs into new windows.
So, reviewing other files while working on a separate file becomes quite a chore. If you’re part of a team that works on Rust projects, you may also benefit from another IDE with better Git integration.
Things to love: JetBrains’ offering of a fully-featured IDE for Rust development, with excellent integration with rust-analyzer, means a development environment that is a joy to use. Given JetBrains’ extensive tooling in areas like Android Studio and IntelliJ IDEA, people who have used their tools previously will appreciate the similar layout and usability of the IDE.
Thoughtful additions, like giving you package versions to choose from while writing a dependency out in the cargo.toml file, go a long way in demonstrating why this IDE is great to develop Rust apps with. And then there are all the other IntelliJ niceties that come along with it, like good Git integration to manage commits and check your new code in. This makes working in teams on Rust projects a little bit easier.
Things to think about: It’s not free. At the time of writing, it’s about $99 USD per year for individuals. Also, having more features means having more requirements, with CLion taking up much more RAM and system resources than VS Code.
Things to love: Fleet is a new addition to the tools one can use to work on Rust apps. It’s still by JetBrains, so much of your knowledge will carry over if you already use one of their IDEs. Better still, it feels more responsive than CLion and has less bloat than other IDEs in the IntelliJ lineup. While it’s in testing (more on that later), it’s also free to use, so it’s well worth checking out if licensing fees are a constraint.
Things to think about: It’s not actually released yet — it’s still in a (fairly long) Early Access Program. If you’re just playing around with Rust as a hobby, that’s probably OK. But, if you’re working on Rust in your day job, you wouldn’t want to pin all your hopes on an IDE that’s still of pre-release quality.
Still can’t make up your mind? Check out this in-depth comparison between VS Code and other IDEs to learn more. For this article, given the widespread usage in the community, and the fact that it is freely available, we’ll consider how to debug our Rust code in VS Code.
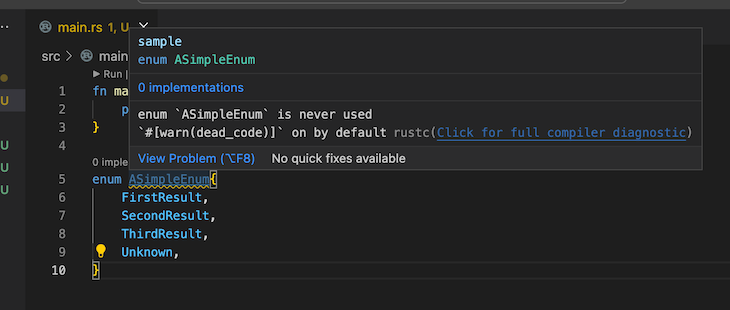
When you use the rust-analyzer extension for VS Code, it provides an array of code linting features, which help you write higher-quality code. For example, if we create an enum and don’t use it, VS Code will display a warning indicating that the declaration of this enum is redundant:
👁 VS Code Terminal With Dark Background Displaying Popup Warning that Enum Declaration is Redundant
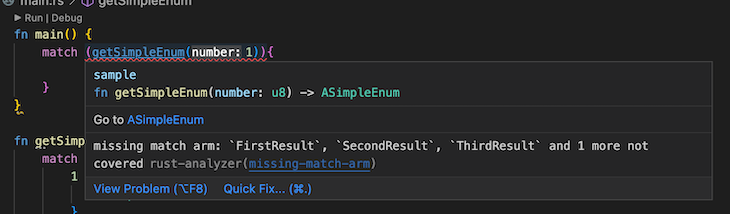
Then, if we use the getSimpleEnum function within our main function, rust-analyzer will prompt if we haven’t used all the results from our match call:
👁 VS Code Terminal With Dark Background Displaying Popup Prompt Listing Missing Match Arms
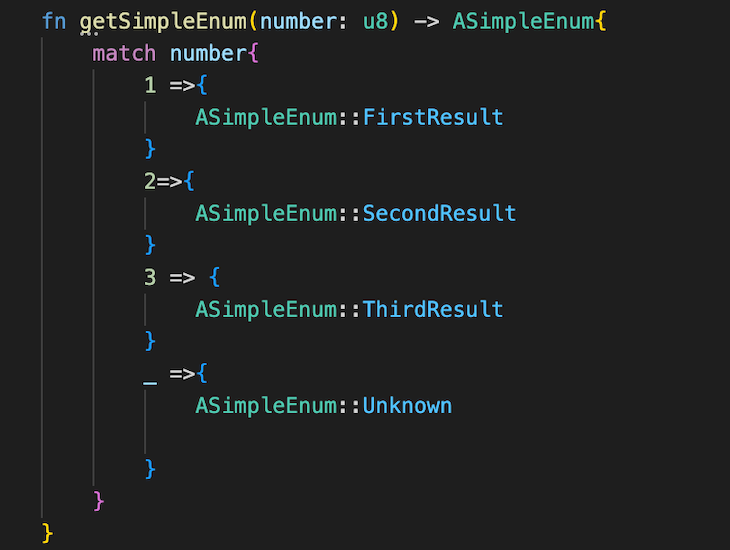
Better yet, the suggestions from rust-analyzer will automatically generate our match arms for us:
👁 VS Code Terminal With Dark Background Showing Four Automatically Generated Enum Match Arms
rust-analyzer has many more features available for us in VS Code. Check out the User Manual to see them all. With VS Code installed on our computer, let’s get started with setting up Rust 🚀.
On macOS or Linux, installing Rust is as simple as typing the following command in your terminal:
$ curl --proto '=https' --tlsv1.3 https://sh.rustup.rs -sSf | sh
On macOS, you’ll also need a C compiler, which you can get by typing xcode-select --install in the terminal. If you’re installing Rust on Windows, the setup is a little different. You’ll need to first retrieve Rust from the website, then install the build tools for Windows. These are part of Visual Studio 2022, so make sure you install the Desktop Development with C++ workload as well as the Windows v10 or v11 SDK.
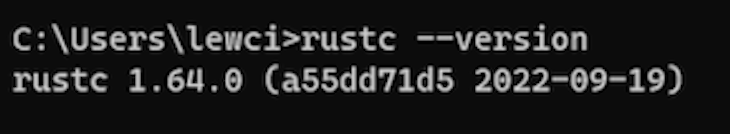
After you’ve done all that, you should have the Rust CLI installed on your computer. You can check by opening a command window or terminal and typing rustc --version. The output should show the version of Rust that you currently have installed, like so:
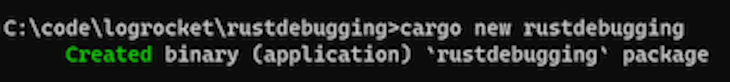
While you are still in your command window, navigate to the directory where you would like to create your project. Then, run cargo new rustdebugging. rustdebugging is the name of our project for this tutorial, but you can call your project something else if you would like to. After a second or so, you should see this message appear in your window:
Now, change directories into our new project by typing cd rustdebugging. Then, typing code . will open VS Code in that directory.
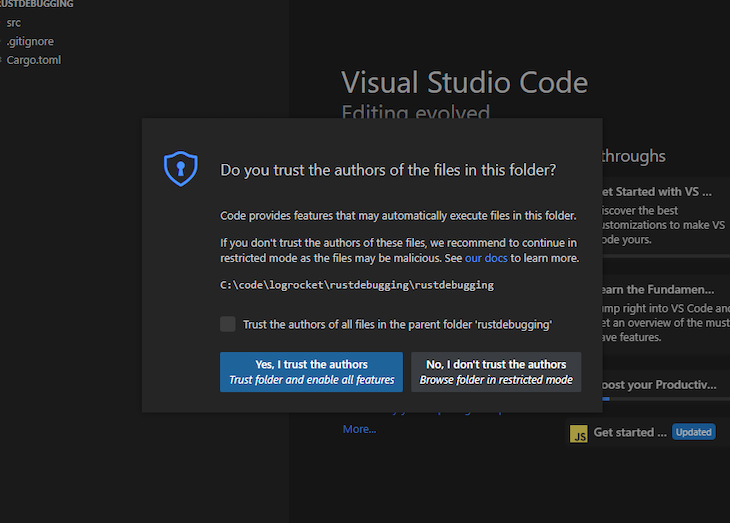
When we first open our project, we need to indicate that we trust the project when we are prompted. Otherwise, we won’t be able to do anything:
👁 VS Code Window With Popup Message Prompting User to Confirm Trust in Authors of Project
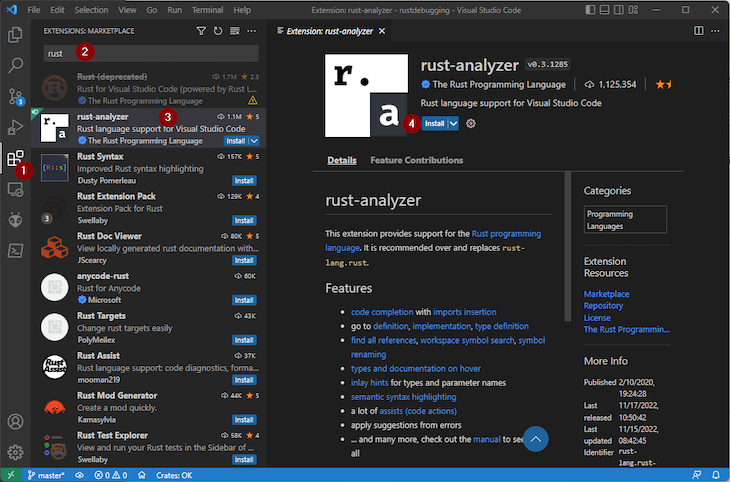
Next, we need to install the rust-analyzer. This is an integral part of compiling and debugging Rust code from within VS Code. Navigate to the EXTENSIONS: MARKETPLACE within VS Code, then find and install the rust-analyzer package, as shown below:
👁 VS Code Extensions Marketplace With Rust Analyzer Pulled Up
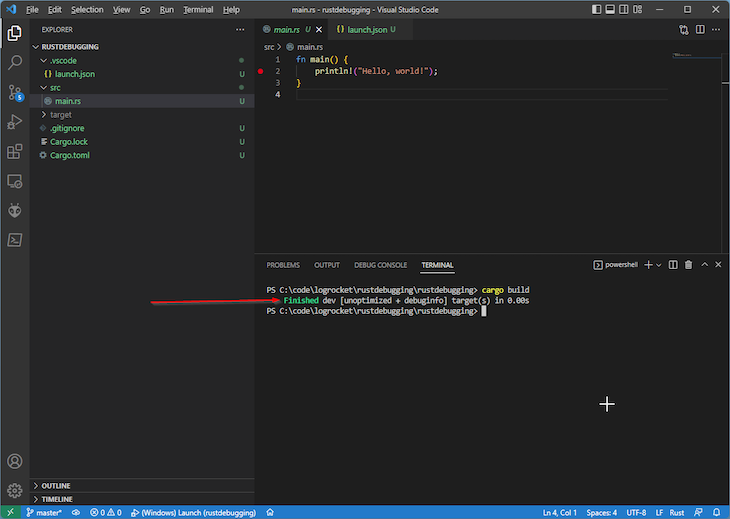
Then, we can open a terminal window from within VS Code and execute cargo build:
After doing that, we should have a new path within our project of target/debug/rustdebugging.exe.
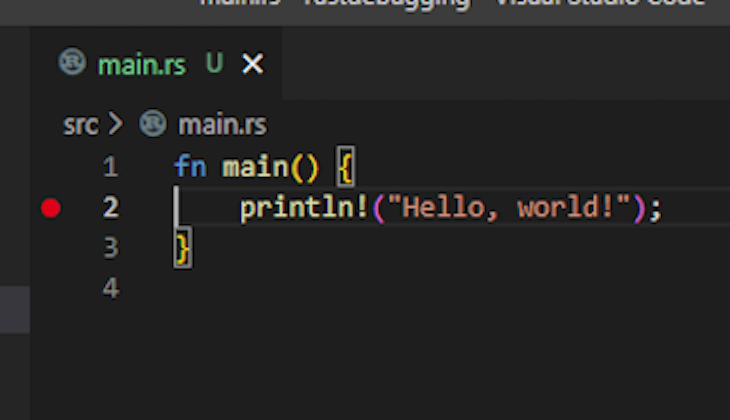
Now, open up your main.rs file, and observe the existing "Hello, World!" statement. If we click to the left of the line numbers, we can set a breakpoint for that particular line:
Once we have set a breakpoint, there will be a little red circle on that line, like so:
👁 Closeup View of Line Two in VS Code Terminal to Show Breakpoint
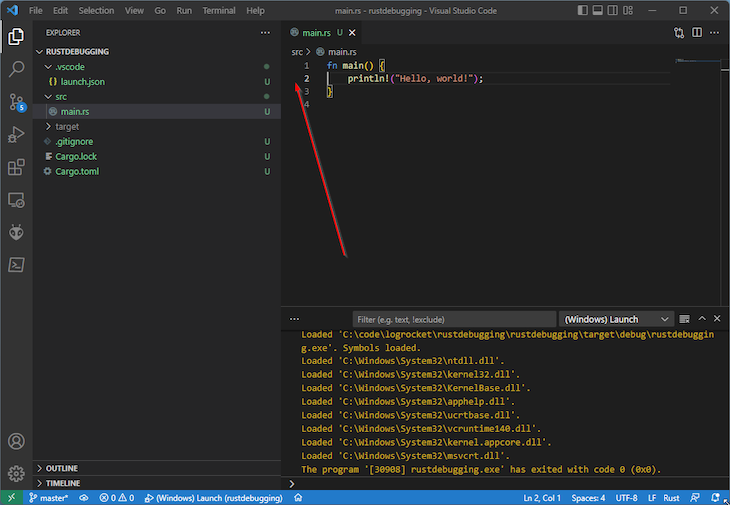
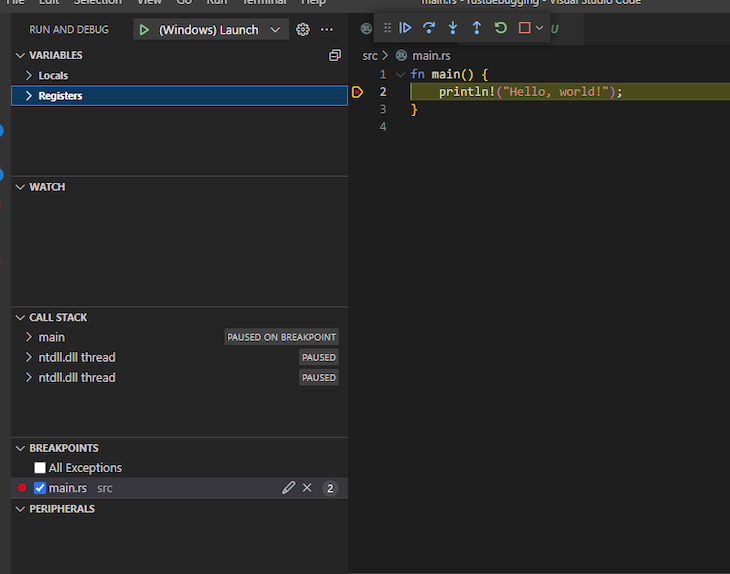
If we hit F5 on the keyboard, a new console window should appear, and our code should stop on that line. We should also see the debug windows in VS Code, such as the Variable view and Call Stack. Our "Hello, World!" line is highlighted in yellow, indicating that is the line that execution is halted on:
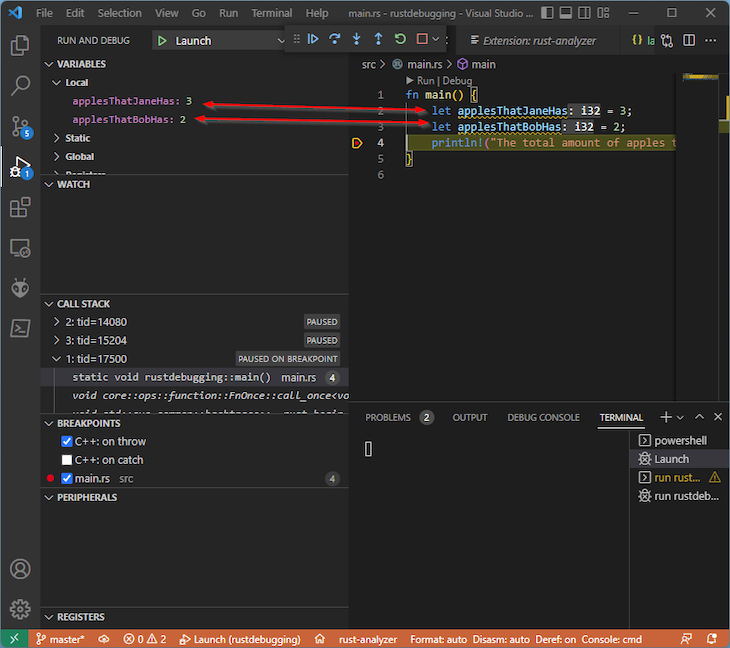
Now, let’s make our code more complex by adding together two numbers. Replace the contents of main.rs with the following:
fn main() {
 let applesThatJaneHas = 3;
 let applesThatBobHas = 2;
 println!("The total amount of apples that everyone has is {:?}", applesThatBobHas + applesThatJaneHas);
}
Now, if we reapply our breakpoint on the println invocation and press F5, our code still stops on that line. But, we can see that we have our local variable view on the left in VS Code:
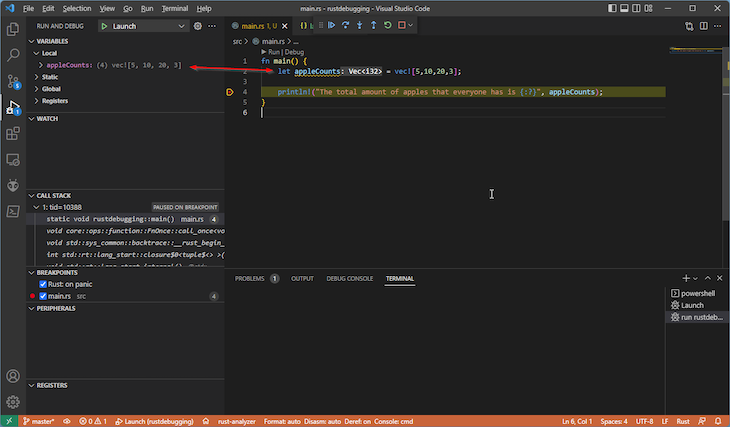
Updating our apple counts to a vec is also visible in the debugger:
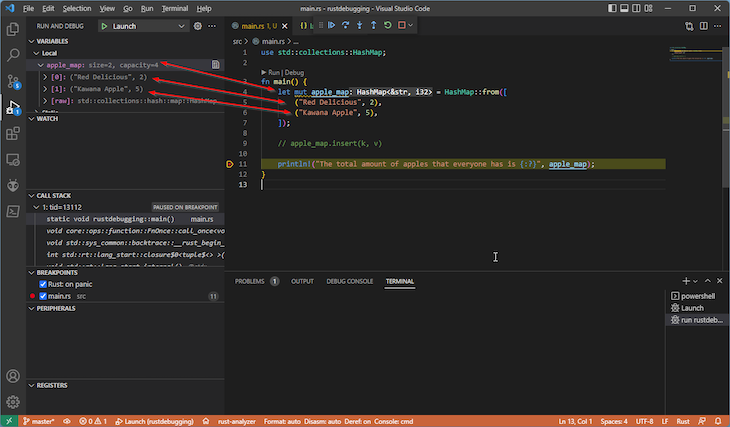
Even other more complicated types like HashMap are explained well in the local variable view. Now, replace the code in main.rs with the following:
use std::collections::HashMap;
fn main() {
 let mut apple_map = HashMap::from([
 ("Red Delicious", 2),
 ("Kawana Apple", 5),
 ]);
 println!("The total amount of apples that everyone has is {:?}", apple_map);
}
With your breakpoints being hit and the variables appearing in the view, you’re all set to debug your Rust programs in VS Code!
While VS Code is an excellent tool for developing Rust projects, developers should keep in mind that it isn’t technically a full IDE. While this can be a good thing — for example, in terms of VS Code feeling responsive to use — it also means that some advanced functionality may not be present in VS Code or may have to be added through extensions.
Another possible issue with VS Code is that, unlike many other developer tools, it’s not possible to tear off tabs from within the editor into new windows. An issue with this functionality has been open for quite some time and shows no sign of changing soon. This doesn’t have to be a big problem, but for many developers who are used to this functionality, it’s something that’s not part of VS Code today.
Now, you are all set up for developing Rust projects in VS Code. You can take this opportunity to install more extensions into VS Code to help your development workflow. Take a look at a few suggestions below.
Rust uses a cargo.toml file to track dependencies and other project metadata. Using the Better TOML extension gives you syntax highlighting and validation. You can use Crates to check whether you are using the most up-to-date crates within your project. This extension helps with updating dependencies, whether one at a time or all at once.
For more advanced debugging for Rust projects within VS Code, check out the CodeLLDB extension. Among other features, this extension lets you set conditional breakpoints.
If you’re getting started with Rust, now would be an excellent time to refer to the official Rust Programming Language tutorials, such as how to program a guessing game. These tutorials provide an excellent introduction to the Rust language as a whole and will help you on your journey to becoming a Rust developer.
Once you have your workspace set up, you’ll be able to work on Rust projects with ease, regardless of your operating system. Happy coding! 🦀
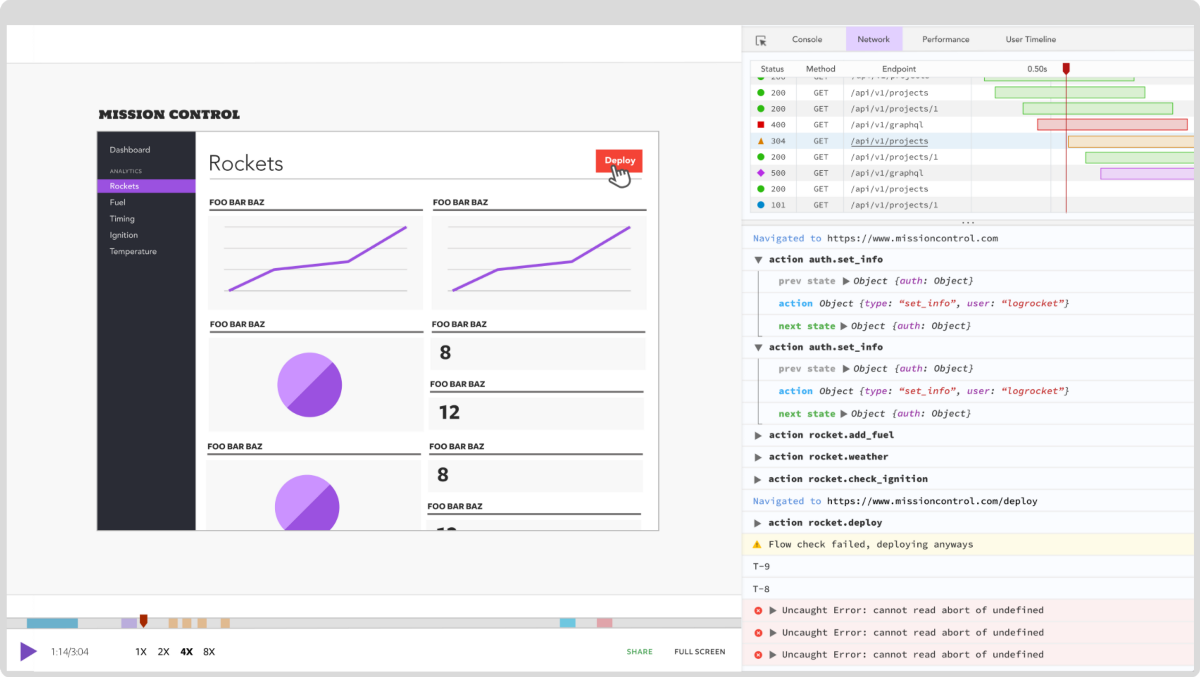
Debugging Rust applications can be difficult, especially when users experience issues that are hard to reproduce. If you’re interested in monitoring and tracking the performance of your Rust apps, automatically surfacing errors, and tracking slow network requests and load time, try LogRocket.
LogRocket lets you replay user sessions, eliminating guesswork around why bugs happen by showing exactly what users experienced. It captures console logs, errors, network requests, and pixel-perfect DOM recordings — compatible with all frameworks.
LogRocket's Galileo AI watches sessions for you, instantly identifying and explaining user struggles with automated monitoring of your entire product experience.
👁 LogRocket Dashboard Free Trial BannerModernize how you debug your Rust apps — start monitoring for free.
TSRX adds first-class control flow, conditional hooks, and scoped styles to React via a TypeScript compiler extension — no new framework required.
Learn how to build a full React Native auth system using Better Auth and Expo — with email/password login, Google OAuth, session persistence, and protected routes.
Compare the top AI development tools and models of June 2026. View updated rankings, feature breakdowns, and find the best fit for you.
Learn how Bloom filters reduce database lookups for username availability checks while preserving correctness at scale.
Hey there, want to help make our blog better?
Join LogRocket’s Content Advisory Board. You’ll help inform the type of content we create and get access to exclusive meetups, social accreditation, and swag.
Sign up now