 |
VOOZH | about |
|
VOOZH | about |
rust-analyzer is a frontend compiler for Rust programming. In other words, it’s an integrated development environment (IDE) server that provides semantic analysis, smart code completion, and more for your Rust code.
👁 Intro to Rust AnalyzerThe Replay is a weekly newsletter for dev and engineering leaders.
Delivered once a week, it's your curated guide to the most important conversations around frontend dev, emerging AI tools, and the state of modern software.
To follow along with this tutorial, you’ll need:
The goals of this tutorial are to break down the benefits of using rust-analyzer over other compilers, demonstrate how to set it up with VS Code, and walk through using some of the most useful features.
You’ll need to understand the following basic terms.
rust-analyzer is developed to monitor user keystrokes, which helps it maintain a persistent compilation process as it analyzes the code on changes. In other words, it analyzes only the code in the file that’s currently active or opened in the IDE or editor.
rust-analyzer is available for most IDEs with LSP support. To name a few, Vim, Emacs and VS Code have plugins for rust-analyzer.
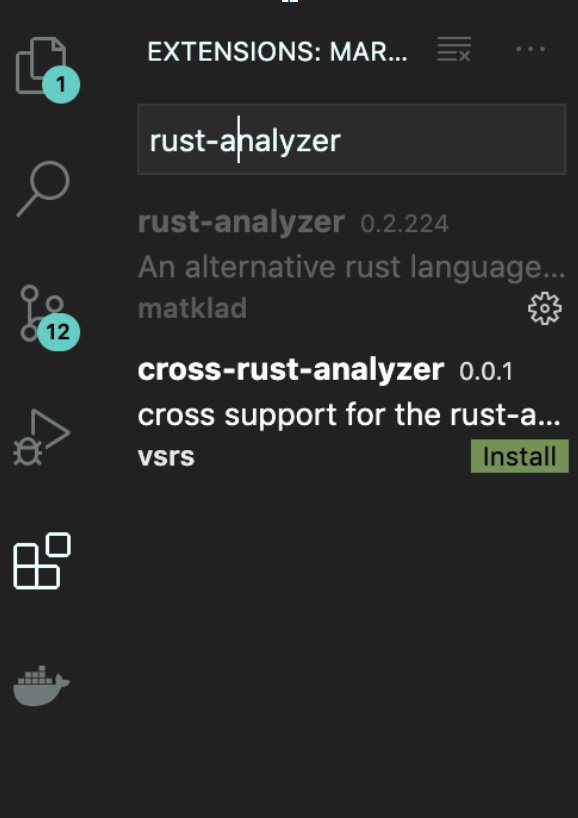
You can install the plugin directly from the Visual Studio Marketplace.
👁 Rust Analyzer in VS Code Marketplace
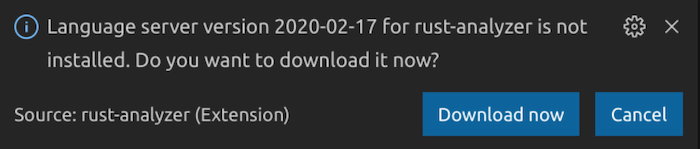
You’ll be prompted to install the rust-analyzer server to make the plugin work.
👁 Install Rust Analyzer Server
To get regular updates, you’ll be prompted to install Nightly on VS Code.
You could also install the rust-analyzer server from binary by following the appropriate procedure below.
rust-analyzer-macrust-analyzer-windows.exerust-analyzer-linuxThe command below is meant for Mac and Linux users. Windows users can easily run the executable file directly.
curl -L https://github.com/rust-analyzer/rust-analyzer/releases/latest/download/rust-analyzer-mac -o ~/.local/bin/rust-analyzer


chmod +x ~/.local/bin/rust-analyzer
Make sure the ~/.local/bin is added or listed in your environment variable.
Now let’s walk through how to use some of rust-analyzer’s key features.
Definition refers to the process of locating a function/struct/impl/mod/pub source code context from the declaration or initialization using the following shortcut.
profile.rspub fn display_fullname(name: &str) {
println!("Welcome back, {}");
}
main.rsmod profile;
fn main() {
profile::display_fullname("Abiodun Solomon");
}
Execute the shortcut above by moving the cursor to the function display_fullname() on main.rs and then hitting fn + F12.
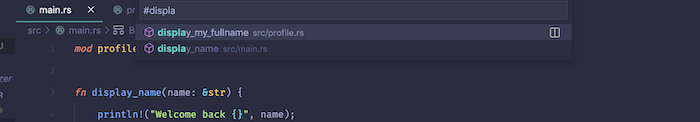
This feature is implemented on existing code search in VS Code, which uses fuzzy search to interface all available symbols — such as structs, enums, functions, etc. — in the whole project.
To do this, hit ctrl/cmd + T , then start the search with the # sign followed by the symbol name.
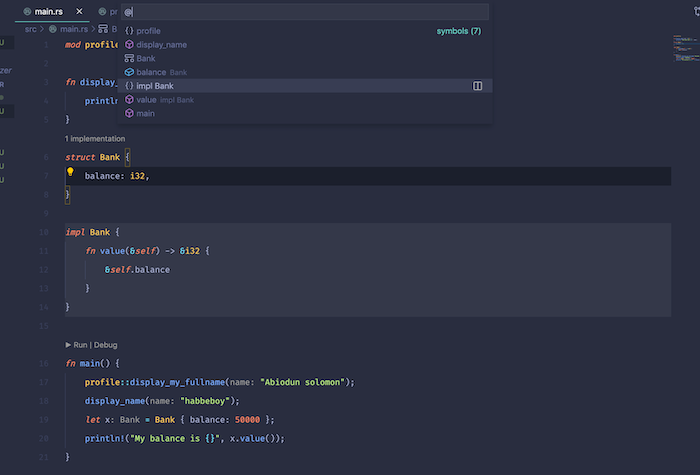
Similar the symbol search, you have to start the search with @ sign or use ctrl/cmd + shift + o. This enables you to critically analyze the code snippets of that particular file and easily navigate on the search pane by switching between code snippets in the same file.
rust-analyzer provides full-fledged syntax highlighting, which helps make your code more readable and understandable. This feature also helps you easily identify bugs in code when the code color changes unexpected.
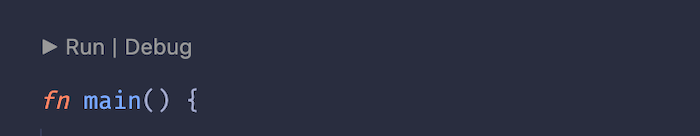
This feature makes it simple to run and debug your code, provided you have CodeLLDB or MS C++ installed. These icons are always at the top of the main function.
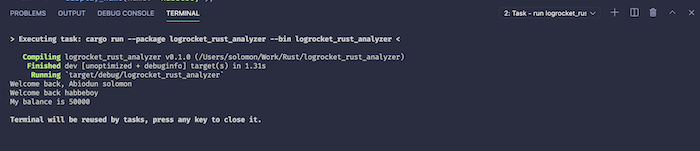
After clicking Run, you should see the terminal building and executing your code without the hassle of typing cargo build and cargo run.
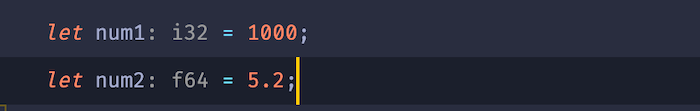
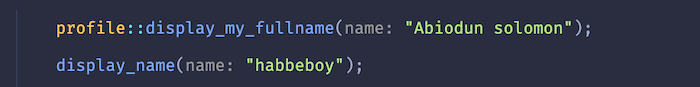
Datatype detection helps you identify the type of data that is assigned to a variable and displays it in gray text at the front of the variable name. It does the same for the function argument by appending the parameters to the front of the value.
The i32 in light gray is added by rust-analyzer to help you understand the type of data available in those variables.
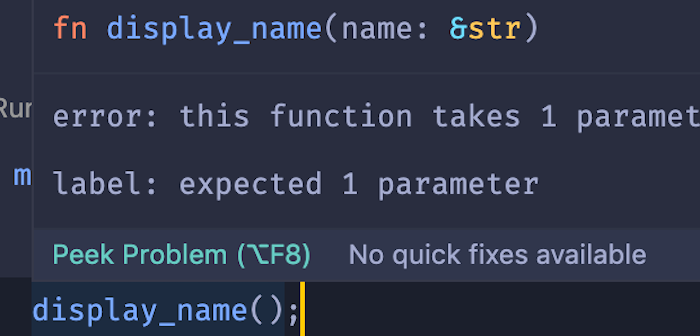
fn display_name(name: &str) {
 println!("Welcome back, {}", name);
}
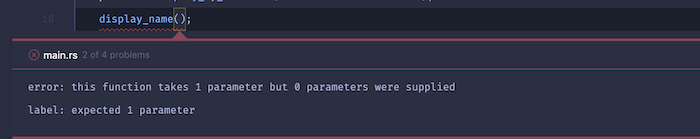
This feature helps you spot errors in your code before execution. A red highlight displays underneath the function and defines the error when hovered over.
Click on peek problem to see the full error message.
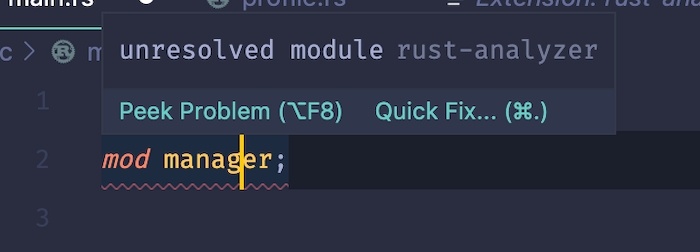
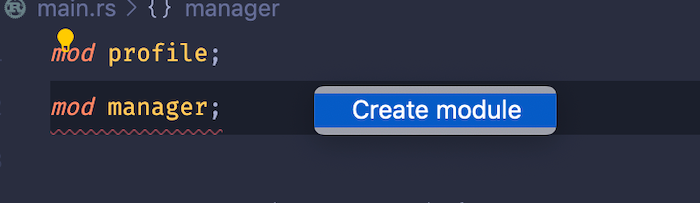
This useful feature enables you to create a missing module when not available in the project by clicking the Quick Fix on the popup dialog box. You could also use ctrl/cmd + . instead.
Click on create module to create a new file called manager.rs, which can be found in your project directory.
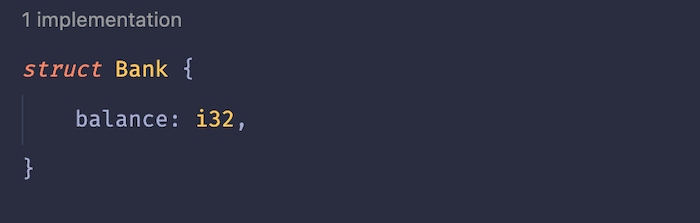
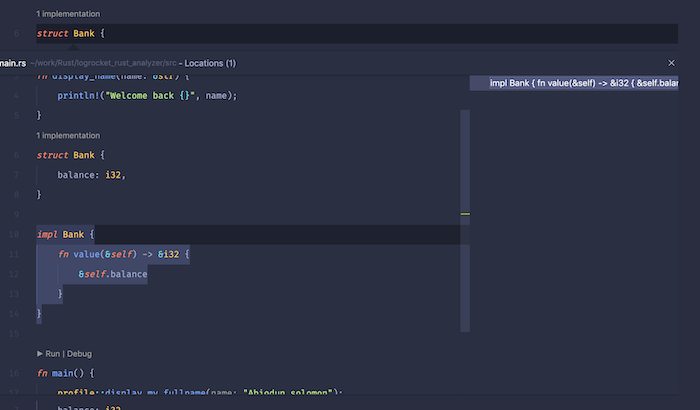
This feature lets you index struct declarations throughout the whole project. It’s particularly useful when you have a large number of structs in your project.
The above example is peeking the struct implementation in a single file. The struct declaration and usage are both in the same file. You could also peek the implementation when the struct and the usage are both in different Rust files, depending on the structure of your project.
You should now have a clear understanding of the Language Server Protocol and the difference between rust-analyzer and Rust Language Server. With the knowledge you gained from this tutorial, you’re ready to take full advantage of the semantics analysis and smart code completion capabilities of rust-analyzer.
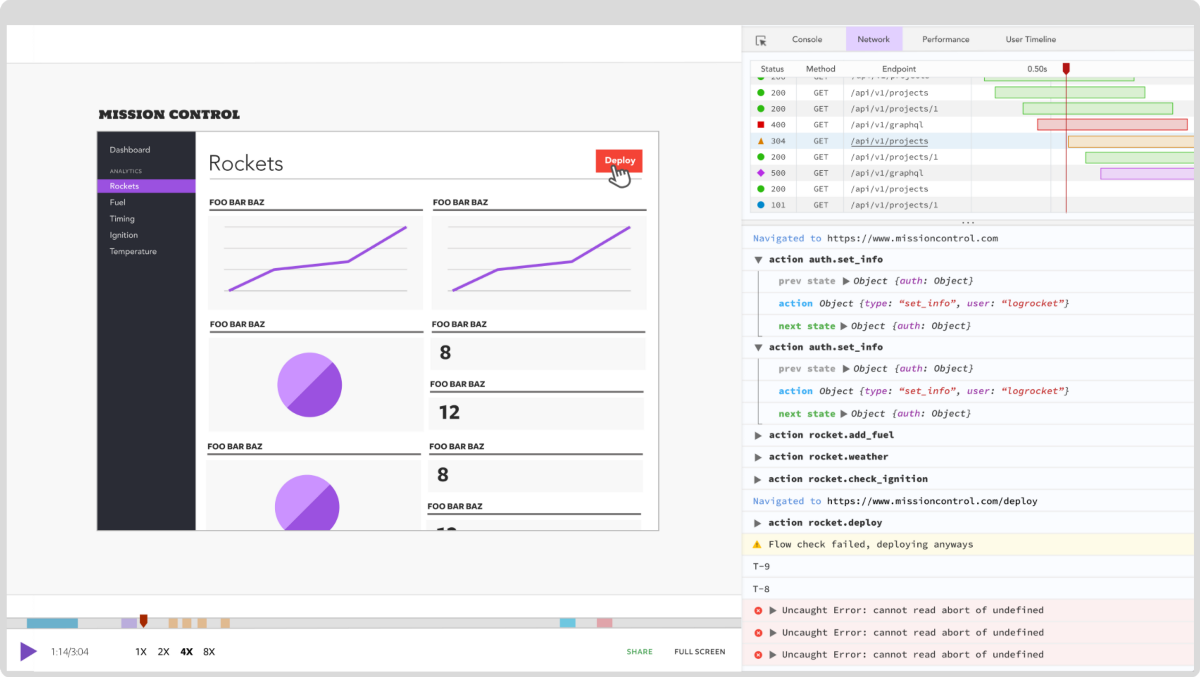
Debugging Rust applications can be difficult, especially when users experience issues that are hard to reproduce. If you’re interested in monitoring and tracking the performance of your Rust apps, automatically surfacing errors, and tracking slow network requests and load time, try LogRocket.
LogRocket lets you replay user sessions, eliminating guesswork around why bugs happen by showing exactly what users experienced. It captures console logs, errors, network requests, and pixel-perfect DOM recordings — compatible with all frameworks.
LogRocket's Galileo AI watches sessions for you, instantly identifying and explaining user struggles with automated monitoring of your entire product experience.
👁 LogRocket Dashboard Free Trial BannerModernize how you debug your Rust apps — start monitoring for free.
Learn how next-browser gives AI agents runtime context for debugging Next.js apps, including React props, hydration, PPR, forms, and performance.
Build dynamic LLM routing in Next.js with OpenRouter, TanStack AI, task classification, model fallbacks, and cost-aware routing.
TSRX adds first-class control flow, conditional hooks, and scoped styles to React via a TypeScript compiler extension — no new framework required.
Learn how to build a full React Native auth system using Better Auth and Expo — with email/password login, Google OAuth, session persistence, and protected routes.
Would you be interested in joining LogRocket's developer community?
Join LogRocket’s Content Advisory Board. You’ll help inform the type of content we create and get access to exclusive meetups, social accreditation, and swag.
Sign up now