 |
VOOZH | about |
|
VOOZH | about |
As your web app grows in complexity, it becomes essential to master the art of debugging.
👁 debugging javascript web appsEffective JavaScript debugging involves more than just fixing errors. It requires an understanding of how your code works under the hood to ensure your app runs smoothly and delivers the best user experience.
Minified code, which is the version of your code that reaches users in production, is optimized for performance. However, minified code can be a nightmare to debug. When users encounter errors, reproducing and diagnosing issues in minified code is often challenging.
However, with the right tools, JavaScript debugging can become much easier. This article will explore how to leverage source maps to debug minified code and dive into other techniques using Chrome DevTools to efficiently identify and resolve issues in your web app.
The Replay is a weekly newsletter for dev and engineering leaders.
Delivered once a week, it's your curated guide to the most important conversations around frontend dev, emerging AI tools, and the state of modern software.
We’ll work on a simple app that increments a count and logs it onto the console. This app demonstrates how minified code can make debugging tricky and how source maps can help simplify the process.
Create the .js files below and add the code snippets as shown:
1. src/counterCache.js
export const countCache = {
 previousCount: 0,
 currentCount: 0,
 totalCount: 0
}
export function updateCache(currentCount, previousCount) {
 countCache.currentCount = currentCount;
 countCache.previousCount = previousCount; c
 ountCache.totalCount = countCache.totalCount + countCache.currentCount;
}
2.src/counter.js:
import { updateCache } from './counterCache.js';
let count = 0;
export function incrementCounter()
 { count += 1;
 const previousCount = count;
 updateCache(count, previousCount);
}
3.src/index.js:
import { incrementCounter } from './counter';
import { countCache } from './counterCache';
const button = document.createElement('button');
const previousElement = document.getElementById('previous');
const currentElement = document.getElementById('current');
const totalElement = document.getElementById('total');
button.innerText = 'Click me';
document.body.appendChild(button);
button.addEventListener('click', () => {
 incrementCounter();
 previousElement.innerText = countCache.previousCount;
 currentElement.innerText = countCache.currentCount;
 totalElement.innerText = countCache.total();
});
In your package.json file, add the webpack packages as shown below then run npm i to install them. We’ll use webpack as part of the build process to generate minified code for production:
 "devDependencies": {
 "webpack": "^5.96.1",
 "webpack-cli": "^5.1.4"
 }
To enable code minification, add a webpack.config.js file with the following snippet. Setting the mode to production tells webpack to apply optimizations such as modification:
 const path = require('path');
 module.exports = {
 mode: 'production', // Enables optimizations like minification and tree-shaking
 entry: './src/index.js', // Specifies the entry point of your application
 output: {
 path: path.resolve(__dirname, 'dist'),// Defines the output directory for bundled files
 filename: 'bundle.js',// Specifies the name of the bundled file
 },
 };
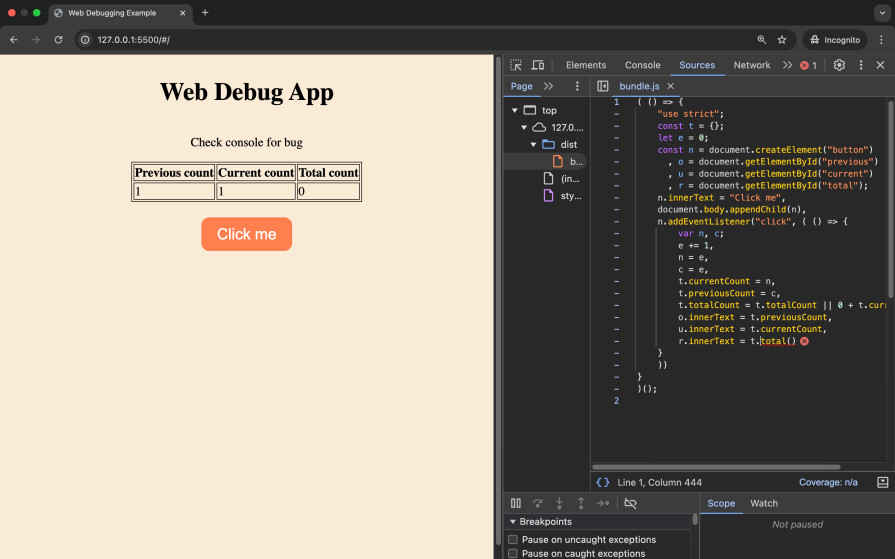
Now run npx webpack to bundle and minify your code. The dist/bundle.js file is generated with content as shown below. Minification obscures variable and function names, and removes unnecessary characters like whitespace, comments, and unused code, making the output file smaller and faster to load:
(()=>{"use strict";const t={};let e=0;const n=document.createElement("button"),o=document.getElementById("previous"),u=document.getElementById("current"),r=document.getElementById("total");n.innerText="Click me",document.body.appendChild(n),n.addEventListener("click",(()=>{var n,c;e+=1,n=e,c=e,t.currentCount=n,t.previousCount=c,t.totalCount=t.totalCount||0+t.currentCount,o.innerText=t.previousCount,u.innerText=t.currentCount,r.innerText=t.total()}))})();
Next, update the index.html file to reference the bundled output, ensuring your application uses the minified code:
<<!DOCTYPE html>
<html lang="en">
<head>
 <meta charset="UTF-8">
 <meta name="viewport" content="width=device-width, initial-scale=1.0">
 <title>Web Debugging Example</title>
 <link rel="stylesheet" href="styles.css">
</head>
<body>
 <h1>Web Debug App</h1>
 <p>Check console for bug</p>
 <table>
 <thead>
 <tr>
 <th>Previous count</th>
 <th>Current count</th>
 <th>Total count</th>
 </tr>
 </thead>
 <tbody>
 <tr>
 <td id="previous">0</td>
 <td id="current">0</td>
 <td id="total">0</td>
 </tr>
 </table>

 <script src="./dist/bundle.js" ></script> <!-- Include the bundled output -->
</body>
</html>
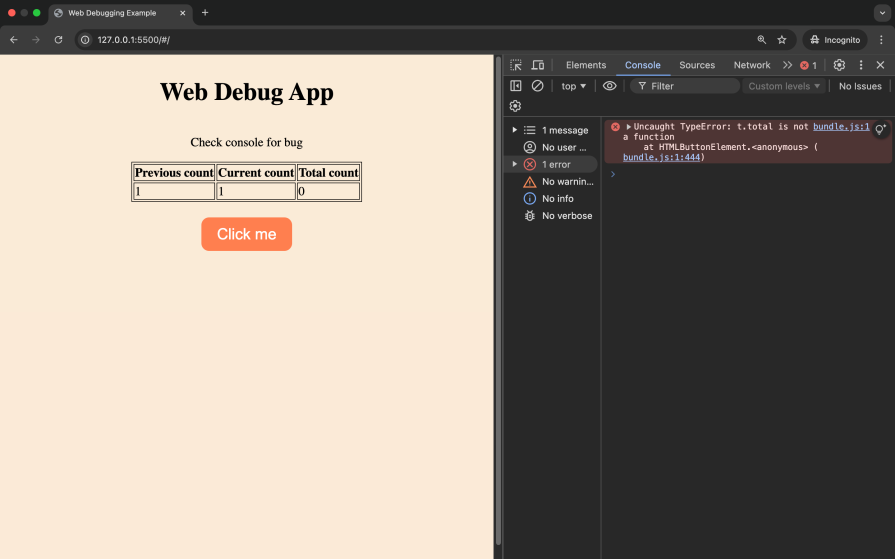
Finally, run the app and check the console after clicking the button. To preview the app locally, you can use the Live Server extension in VS Code:
👁 app error using minified code
The error in the console, t.total is not a function, is difficult to interpret. Clicking on the file in the console does not help pinpoint the issue due to the compact and obfuscated nature of minified code. Identifying the root cause of such an error in a large codebase can be frustrating and time-consuming, as the minified code obscures the original logic and context.
Let’s demonstrate eight methods to help make JavaScript debugging a bit easier:
Source maps are files that map your minified code back to the original source code. They make debugging easier and help investigate issues in production. The file names of source maps end with .map.
To generate source maps using webpack, update the webpack.config.js file as follows:
The devtool: 'source-map' or devtool: 'eval-source-map' line tells webpack to generate an external .map file which maps the minified code back to your original source code. The source map file URL is also added to the minified code in the bundle.js file.
Now run npx webpack. The .map file will generate alongside your minified bundle. Serve the application using a local server, and open it in an Incognito browser window. This prevents browser extensions and cached files from interfering with your debugging process.
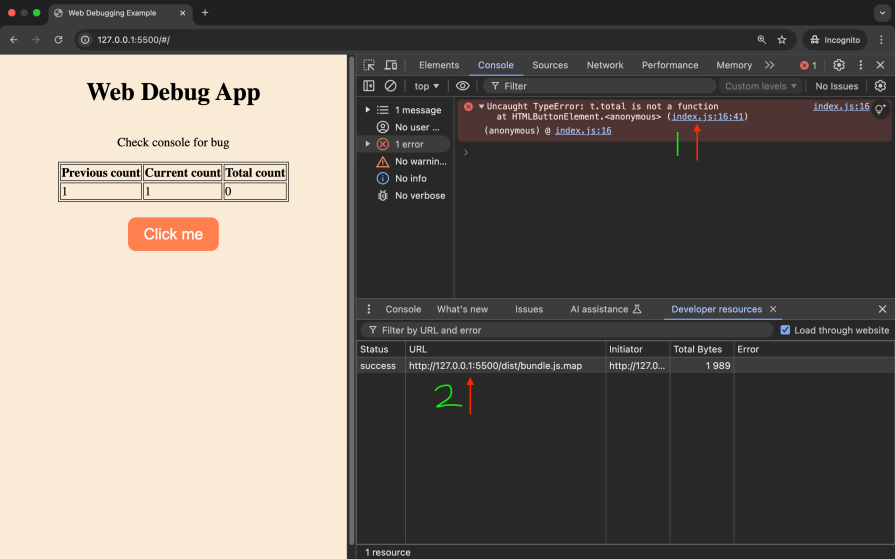
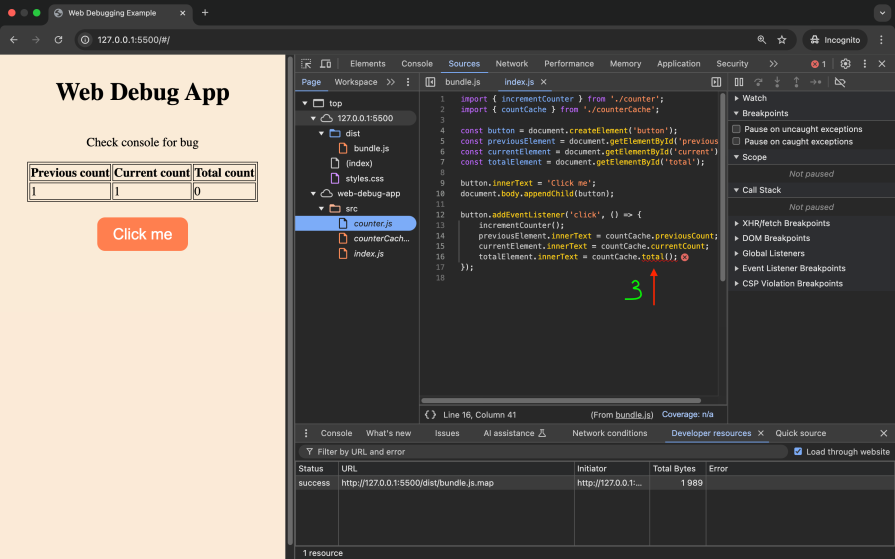
With source maps generated, the following observations are made:
counter.js file, which is the original source codebundle.js.map is successfully fetched and is visible under the Developer resources tabThe exact code and file causing the bug are easy to identify using source maps:
👁 mapped source code javascript debugging
With the clear error above, we are able to fix the error and access the correct property on countCache.
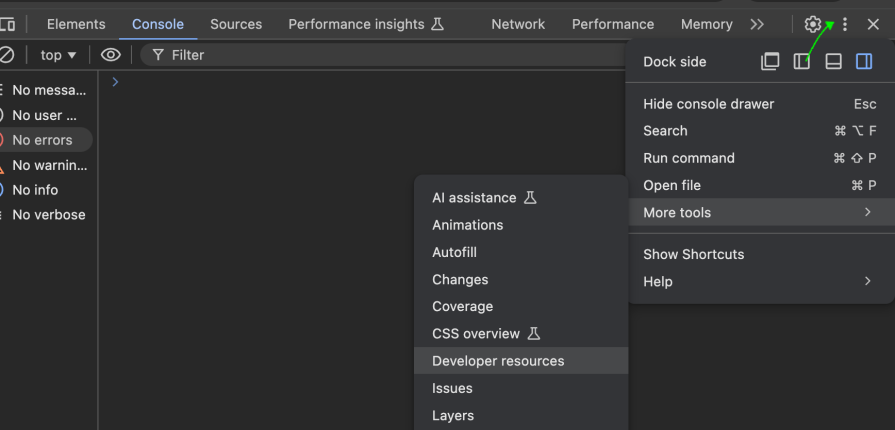
Our guide on how to use Chrome DevTools should provide a great start. To open the Developer resources tab, click on the More icon, then More tools then Developer resources. This tab allows you to view the source map load status and even load source maps manually:
👁 accessing developer resources tab javascript debugging
The code snippet below fixes the bug on the console. Update your code, then run npx webpack to compile the changes. Once completed, serve the application and view the updated output in the table:
totalElement.innerText = countCache.totalCount;
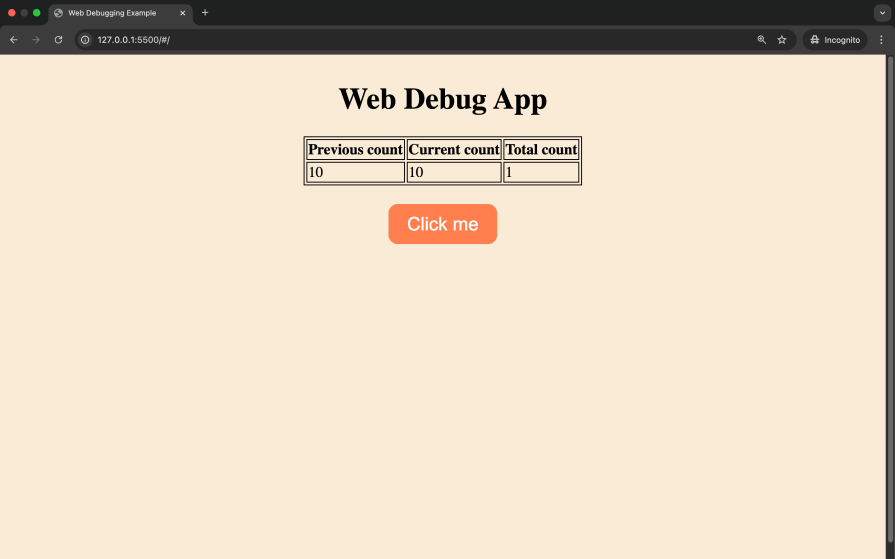
Clicking the button currently updates the previous count, current count, and total on the table. The previous count is supposed to return the previous value of count and the total count is to return the sum of all count values. At the moment, the previous count displays the current count while the total count is stuck at one.
In the next section, we’ll explore additional JavaScript debugging techniques, such as using breakpoints and stepping through the code, to identify and fix this issue:
👁 web debugging example app output
Breakpoints allow you to pause the execution of your code at specific lines, helping you inspect variables, evaluate expressions, and understand the code flow. Depending on your goal, there are different breakpoints you can use. For instance:
In our sample application, we’ll apply a breakpoint to the incrementCounter function. On the Sources panel, open the counter.js file and click to the left of line six. This sets a line-of-code breakpoint after the count is increased:
👁 setting line of code breakpoint
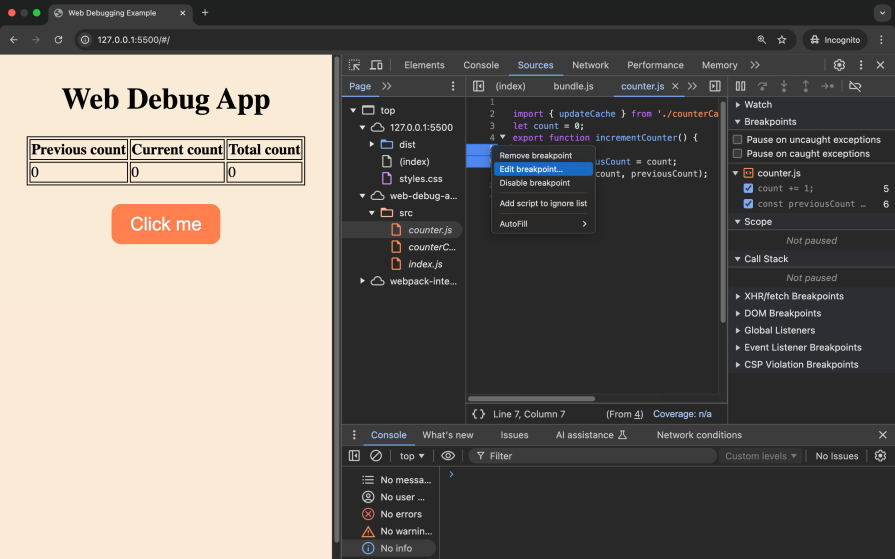
We’ll set another breakpoint at line five and edit it. To edit our breakpoint, we’ll right-click on the highlighted section and then click on Edit breakpoint:
👁 edit breakpoint javascript debugging
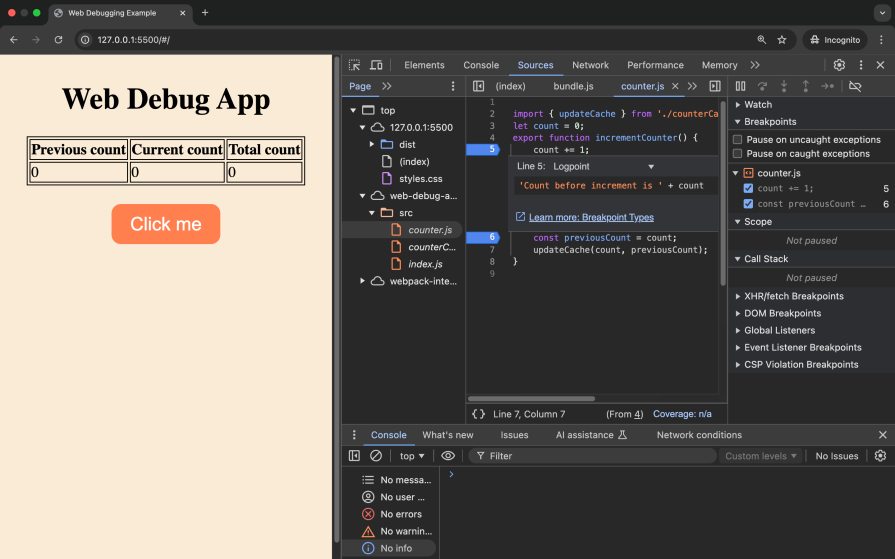
We’ll set the breakpoint type to Logpoint, then enter the message to be logged to the console:
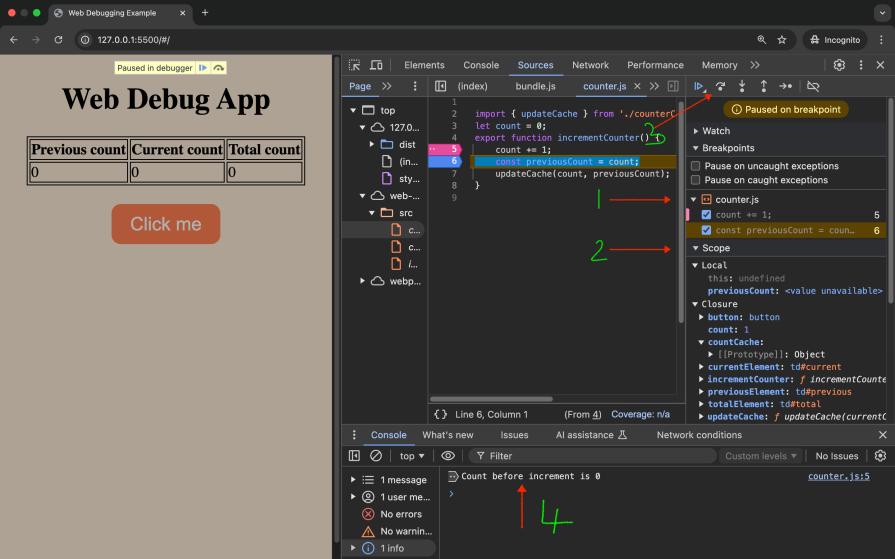
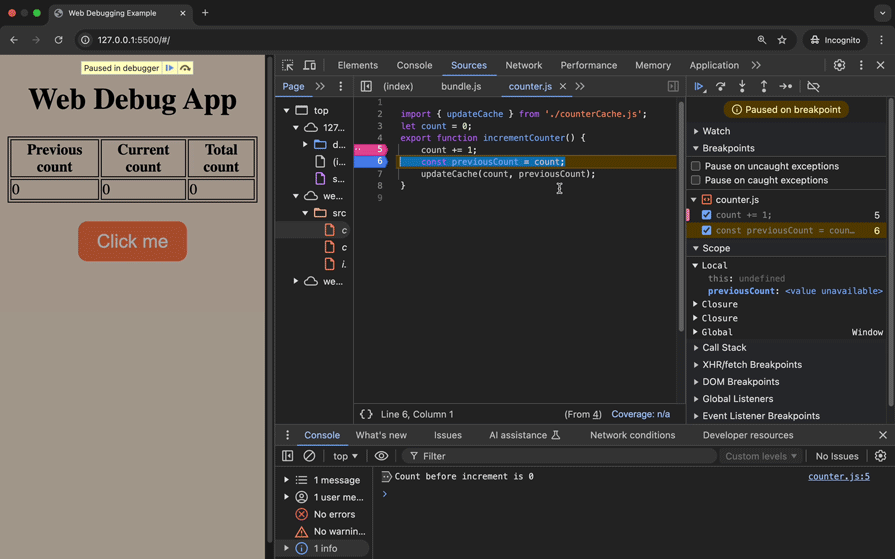
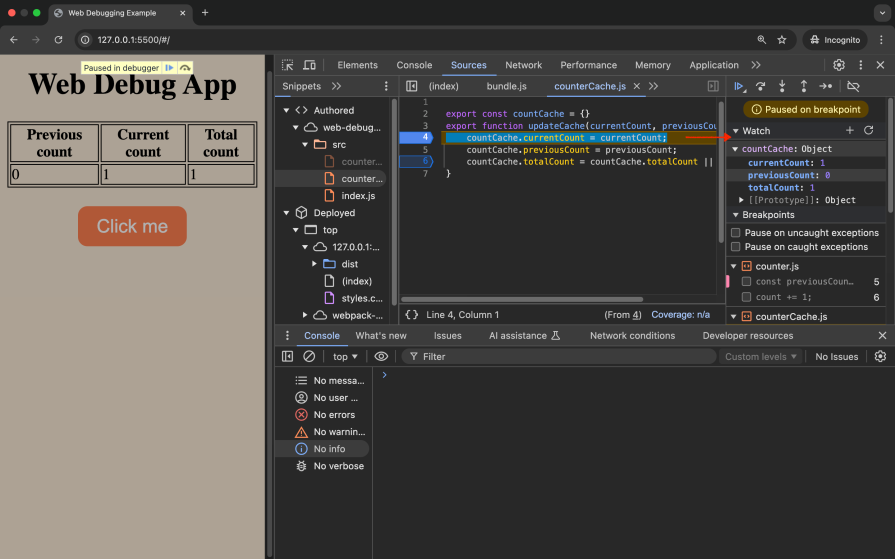
By clicking the button, our application pauses at the line-of-code breakpoint and prints a debug log on the console from the Logpoint set:
👁 app paused line of code breakpoint
From the image we can see the following sections:
With this, we can debug our app further.
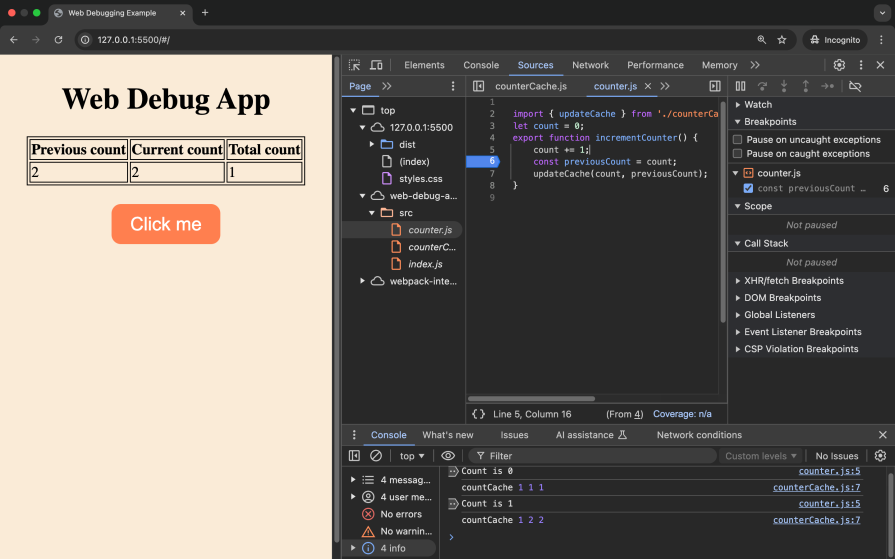
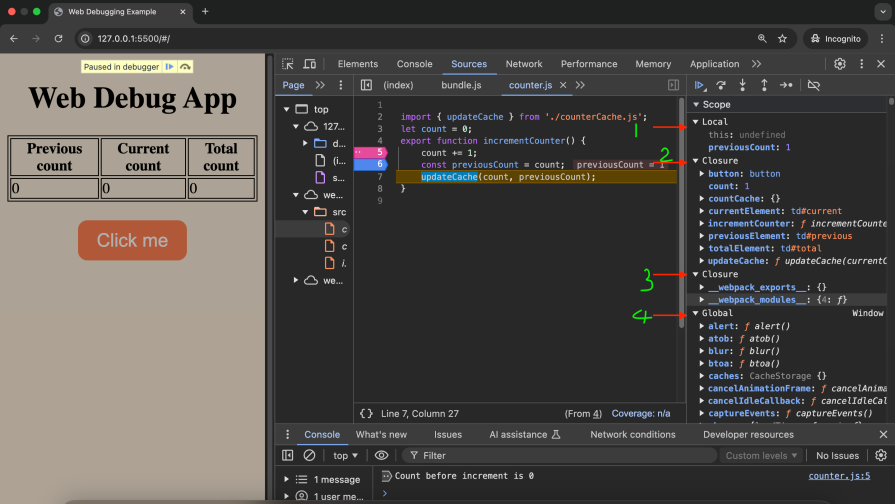
The scope panel can be effective for JavaScript debugging, as it allows you to see variables from the original source:
👁 scope panel javascript debugging
We can see the following scope variables:
From the scope panel and the log point breakpoint, we can see that the current count is one while the count before the increase is zero. We therefore need to store the count before the increment as the previous count.
Stepping through your code involves navigating through the program in different ways during JavaScript debugging:
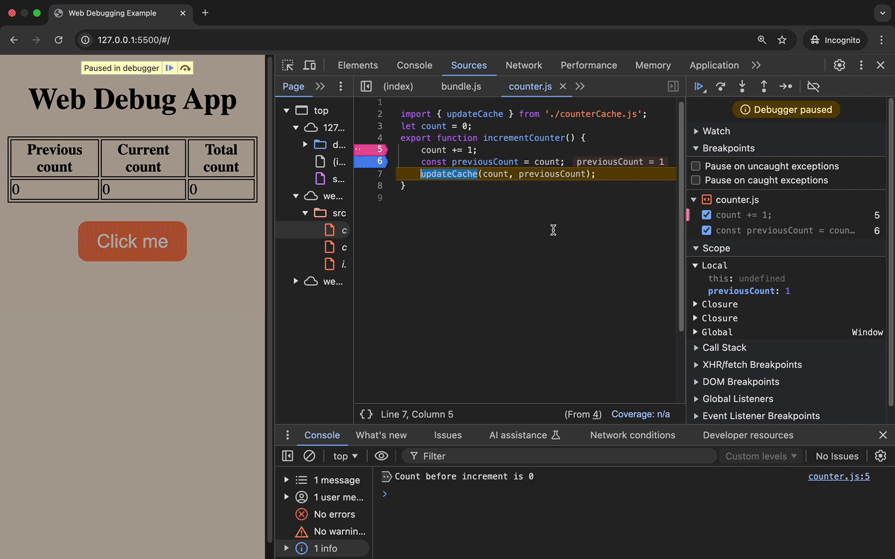
You can use the debug controls to step through your code. The Step control enables you to run your code, one line at a time. Clicking on Step will execute line six and move to line seven. Note how the value of previousCount changes in the scope:
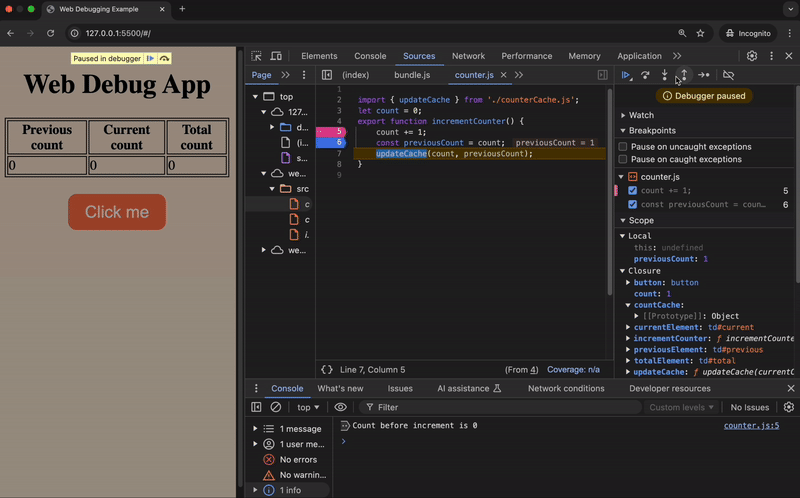
The Step over control allows you to execute a function without going through it line by line:
The Step into control allows you to go into a function. In the function, you can step through the code line by line or Step out of the function as shown below. Stepping out of the function will finish the execution of the remaining lines:
👁 step into and out of code chartdb
To fix our issue, we’ll update the code as shown below. This now displays the previous count on the table correctly:
import { updateCache } from './counterCache.js';
let count = 0;
export function incrementCounter() {
 const previousCount = count;
 count += 1;
 updateCache(count, previousCount);
}
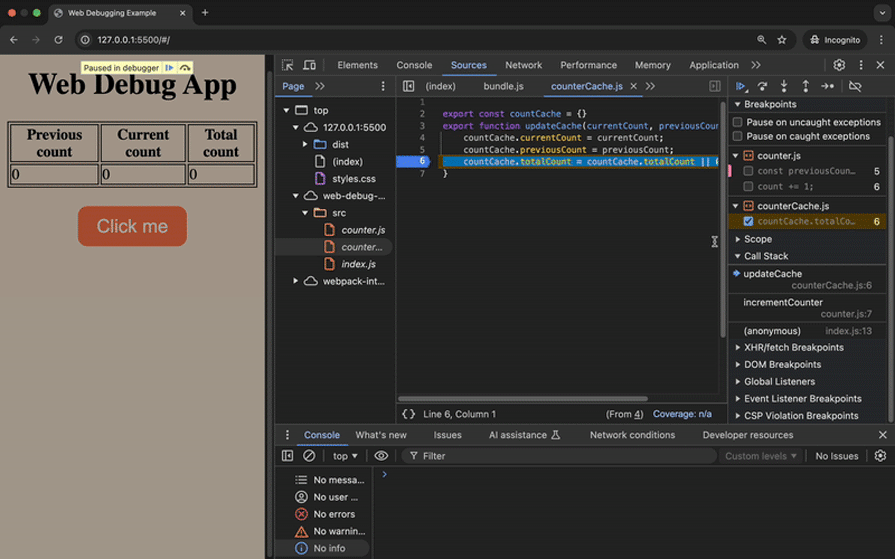
The call stack shows the sequence of function calls that led to the current point in the code.
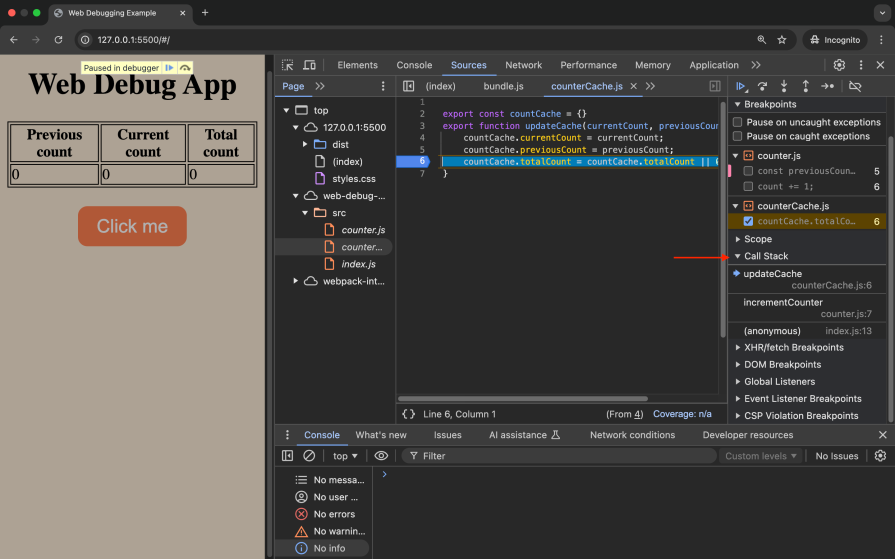
Add a new breakpoint in the counterCache.js file as shown, then click the button. Observe the call stack panel:
There are three function calls made when the app executes line six of counterCache.js. To observe the flow of any functions in the stack, you can restart their execution using Restart frame, as shown below:
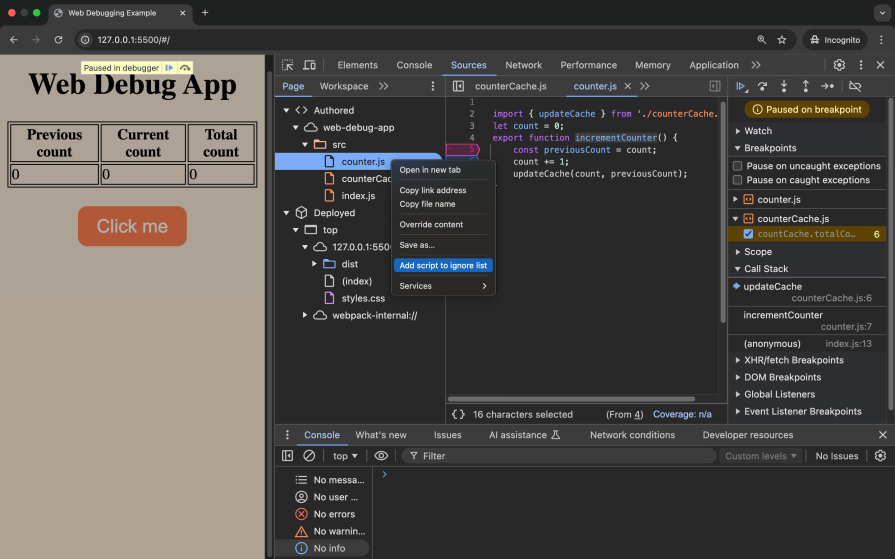
When debugging, you may wish to ignore certain scripts during your workflow. This helps skip over the complexities of code from libraries or code generators. In our case, we want to ignore the counter.js script while debugging.
On the Page tab, right-click on the file to be ignored and add the script to the ignore list:
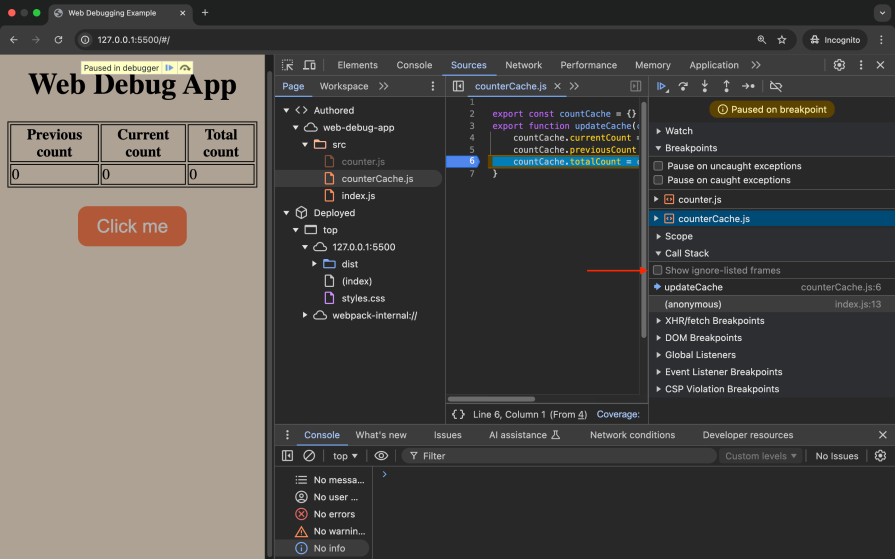
Running the app and pausing on the breakpoint, we can see the incrementCounter function is now ignored on the call stack. You can hide or show the ignored frames:
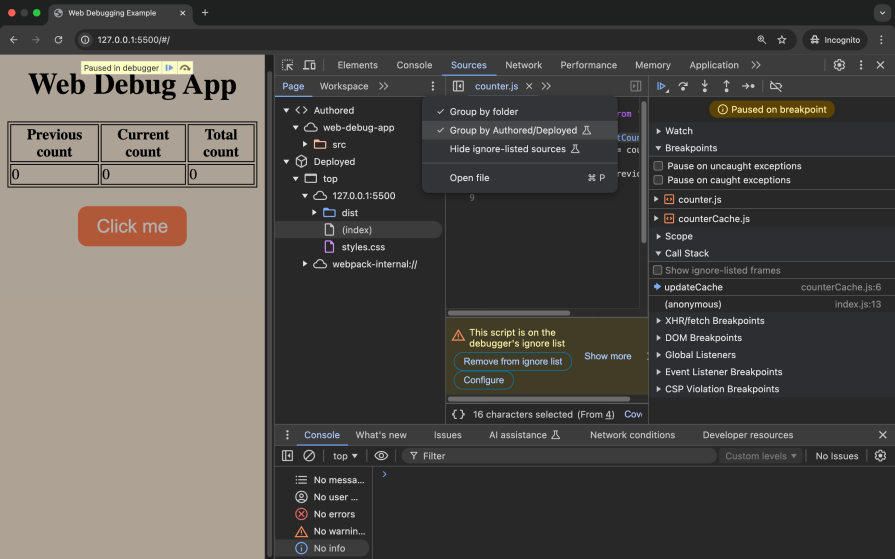
You can group your files in the Pages tab for easier navigation as shown in the image below:
Watch expressions let you track specific variables or expressions as your code executes, helping you monitor changes in real time. You can add expressions like countCache to monitor the value as you step through the code:
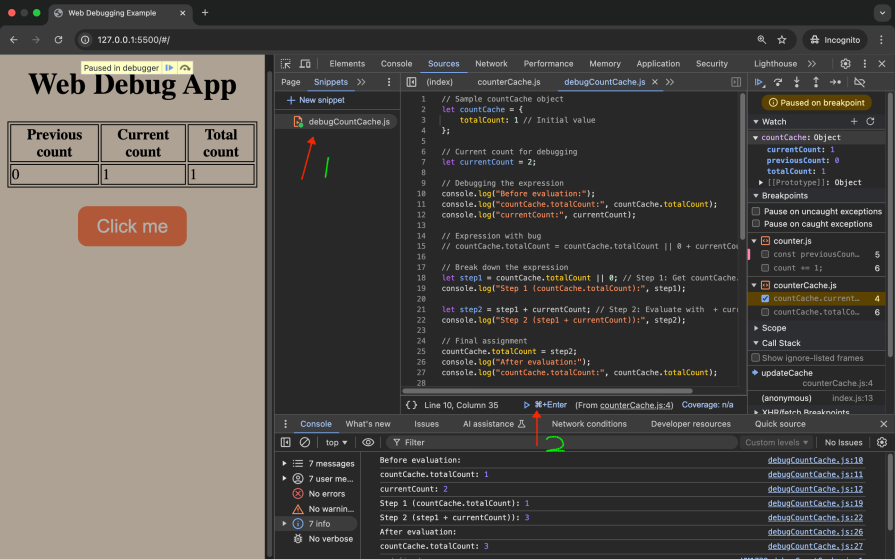
To try to fix the bug with the total count, you may run code snippets on the console to understand the logical error. When debugging code that you run repeatedly on the console, you can make use of Snippets.
On the Snippets tab, add a sample debug script, save the script then click Enter to run the script:
👁 javascript debugging snippet
You can observe that the expression with the bug needs to be rearranged to fix the issue:
countCache.totalCount = (countCache.totalCount || 0) + currentCount;
You can explore additional resources on debugging web apps such as this article on debugging React apps with React DevTools, which offers valuable insights into debugging React-based applications. Additionally, this guide on debugging Node.js with Chrome DevTools provides tips for debugging server-side JavaScript using watchers and other advanced DevTools features. These resources can complement the techniques discussed here and broaden your understanding of debugging web apps.
This tutorial explored debugging minified code by using source maps and Chrome DevTools. By generating source maps, we mapped minified code back to its original source, making it easier to debug our web app. Chrome DevTools further enhanced the JavaScript debugging process with methods such as breakpoints, stepping through code, watch expressions, and more.
With these tools, developers can efficiently debug and optimize their applications, even when dealing with complex, minified codebases. The complete code for this project can be found on GitHub.
Learn how next-browser gives AI agents runtime context for debugging Next.js apps, including React props, hydration, PPR, forms, and performance.
Build dynamic LLM routing in Next.js with OpenRouter, TanStack AI, task classification, model fallbacks, and cost-aware routing.
TSRX adds first-class control flow, conditional hooks, and scoped styles to React via a TypeScript compiler extension — no new framework required.
Learn how to build a full React Native auth system using Better Auth and Expo — with email/password login, Google OAuth, session persistence, and protected routes.
Would you be interested in joining LogRocket's developer community?
Join LogRocket’s Content Advisory Board. You’ll help inform the type of content we create and get access to exclusive meetups, social accreditation, and swag.
Sign up now