 |
VOOZH | about |
|
VOOZH | about |
Any application monitoring solution should maintain an open design, build upon proven technologies, be accessible, and require a low learning curve. The end goal is simple: provide teams with the ability to identify issues or unexpected behavior within minutes, if not seconds. The ELK Stack meets these expectations and more. In this Refcard, you'll cover the basic components of the ELK Stack, how it maps to a log analysis workflow, and step-by-step instructions for installation, configuration, and reporting.
Written By
Application monitoring was initially driven by a few different categorizations:
During that time, application logs originated from a small number of sources: the application server (client and server), database server, and firewall.
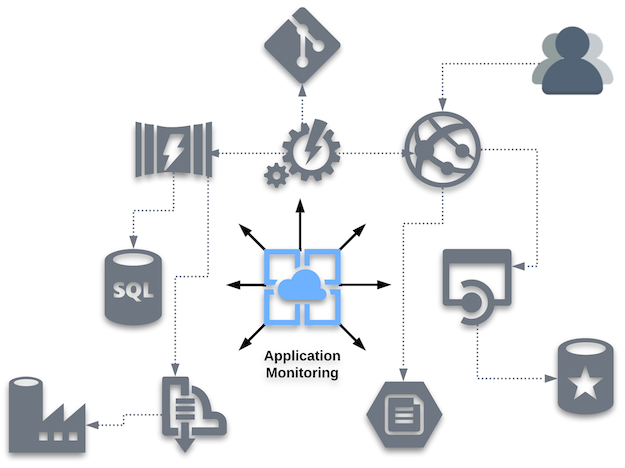
In today’s distributed and cloud-driven application designs, the importance of application monitoring and observability elevates requirements to a higher level — weeding through what seems to be endless log events from a growing number of component sources — as illustrated below:
Figure 1
In addition to those same basic needs are new challenges, like the fact that customers have less tolerance for systems that are not functioning at an expected level.
This is where the ELK Stack can assist in regaining control of application monitoring by enabling engineers to overcome the challenges of monitoring highly distributed, dynamic, and noisy environments. As data is ingested and transformed, an accurate and reliable state of the application can be comprehended in real time — quickly pointing out any unexpected behavior or response time.
The ELK stack was originally created from and named by three open-source frameworks:
Combining these frameworks, the ELK Stack provides a powerful platform that collects and processes data from multiple data sources (Logstash), stores that data in one centralized and scalable data store (Elasticsearch), and provides a set of tools to analyze the data (Kibana).
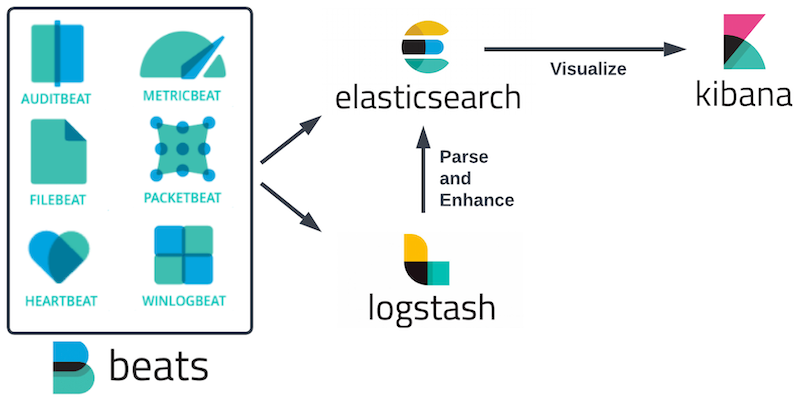
To make gathering data easier, Beats is often used to provide lightweight agents that handle the necessary communication with the ELK Stack. Beats is an open-source collection of log shippers via the API from the libbeat library for the following use cases:
The complete ELK Stack design is noted below, with Beats providing data directly into Logstash and Elasticsearch:
Figure 2
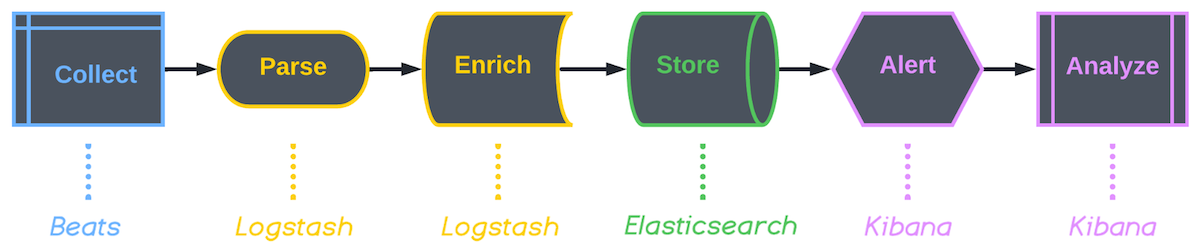
As noted in the introduction, customers have high expectations for the services and applications they utilize. As a result, changes in application performance should be viewed as equally as important as a thrown exception. Log analysis is where an understanding can be gained to determine normal vs. abnormal response times. The illustration in Figure 3 shows the flow for a given log event with these steps:
By default, the ELK Stack was designed to address log analysis, and Figure 3 also shows how the frameworks can map to respective steps in the flow.
Figure 3
There are a few different ways to get started using the ELK Stack:
For this Refcard, the following repository will be used along with Docker Compose to provide a simple installation of the ELK Stack: https://github.com/deviantony/docker-elk
To begin, execute the following steps:
docker-compose.yml file or the Logstash configuration file, but for initial testing, the default settings should suffice.docker-elk folder, execute the following command in a terminal session:Docker-compose up -dDocker statsService Ports
------------- ---------
Elasticsearch 9200/9300
Logstash 5000/5044
Kibana 5601 user: elastic
password: changemeFor additional and up-to-date details, please review "Getting Started With the ELK Stack" in the Elastic Docs.
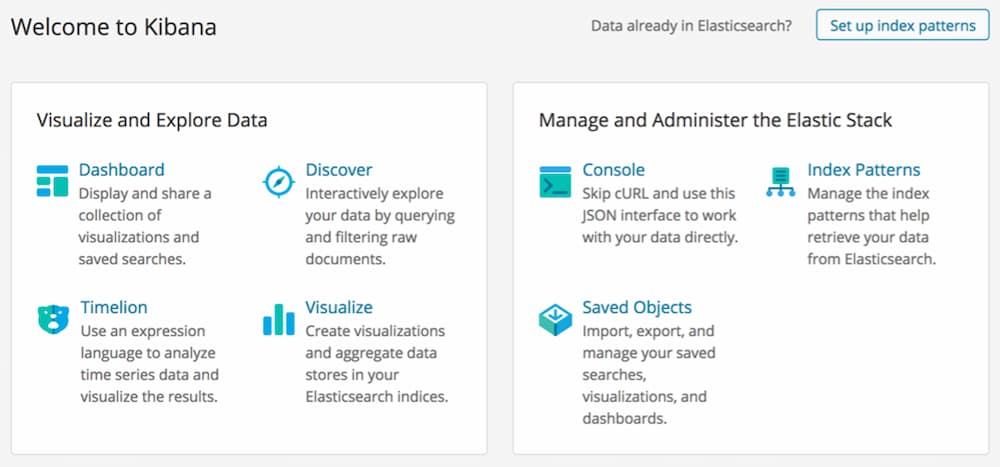
Once some data has been ingested by the ELK Stack, open Kibana using the http://localhost:5601 URL, which will bring you to the dashboard shown in Figure 4.
Single-click the Set up index patterns button in the top right corner of the page to create a new index pattern. This simple example will assume that Metricbeat data has been ingested.
Figure 4
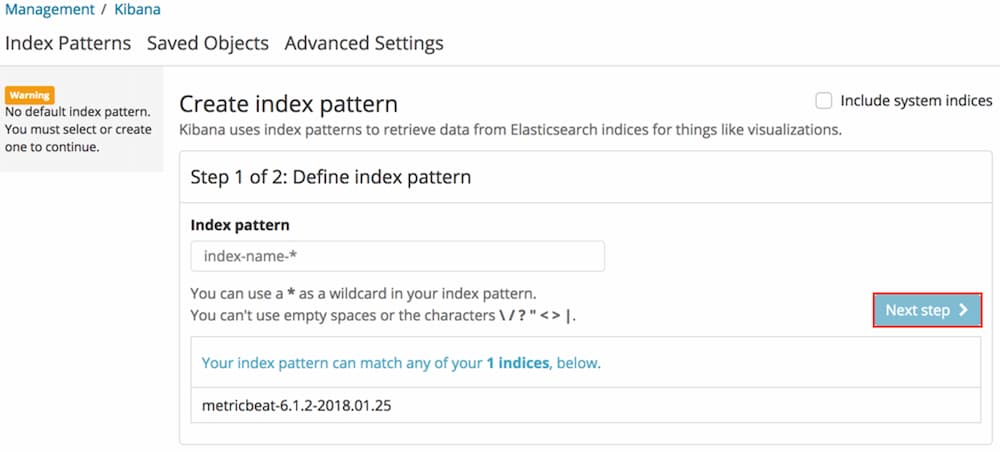
In Step 1 of 2: Define index pattern, provide an index pattern value of index-name-* and single-click the Next Step > button to continue to step two.
Figure 5
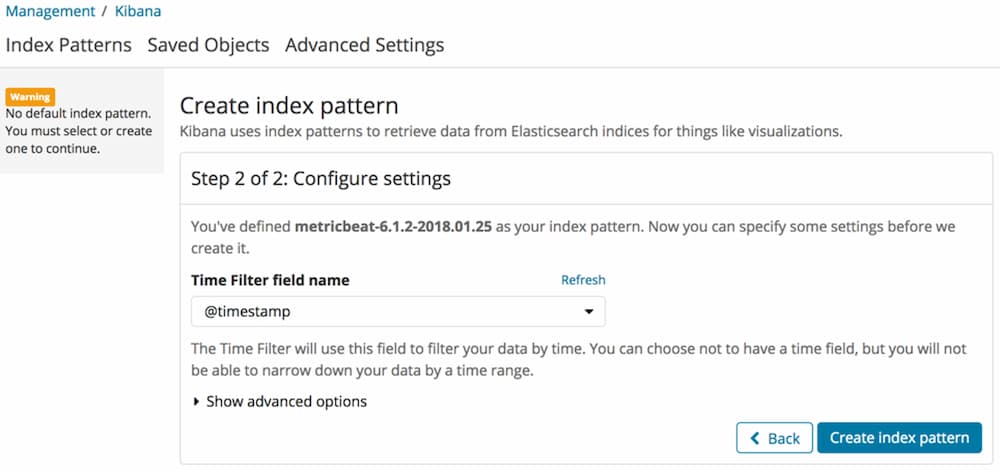
In Step 2 of 2: Configure settings, select the @timestamp time filter and single-click the Create index pattern button to continue to save the new index pattern.
Figure 6
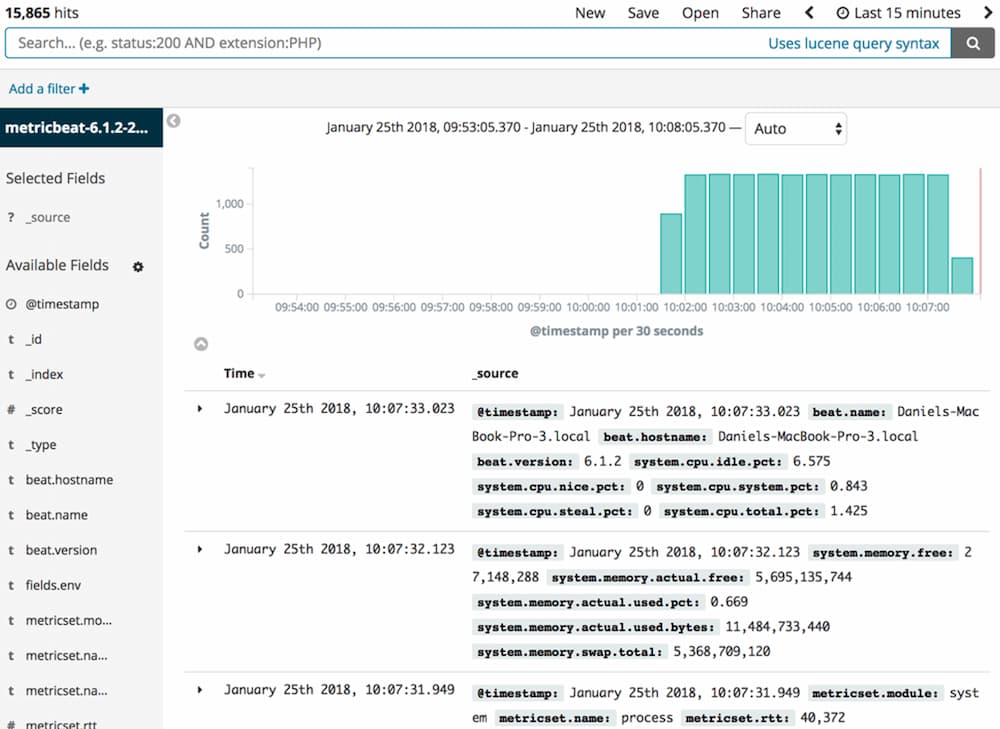
Now, launching the Discover perspective in the Kibana application dashboard presents the information as shown in Figure 7.
Figure 7
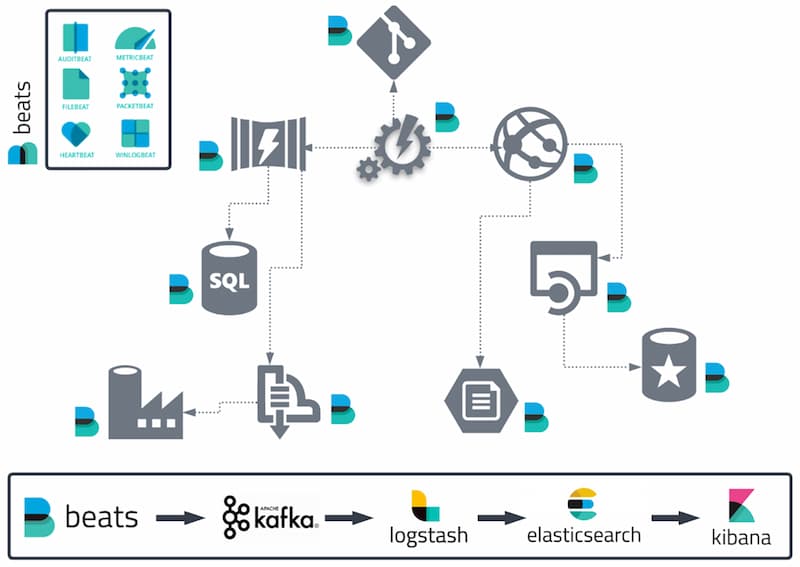
Figure 8 shows a visualization of the ELK Stack in action: Beats components are installed as agents on various elements across the application landscape. Because of the volume of analytical data, an Apache Kafka implementation is inserted into the flow to stream and buffer data being aggregated and processed by Logstash. From there, the standard ELK Stack implementation consumes the components being monitored and observed, leveraging Elasticsearch and Kibana.
Figure 8
The ELK Stack is most commonly used as a log analytics tool, but there are some key use cases that can help justify adoption of the technology.
Software engineers working in cloud-based environments can find themselves at a disadvantage when an expected segment of the application landscape fails to function as expected. Basic troubleshooting techniques often apply, where the engineer navigates the logs from one component to the next. This reduces development productivity and increases the cost to implement a given feature or function. Employment of the ELK Stack aggregates the logs and provides observability and searchability across the entire application landscape, allowing the development lifecycle to continue at the expected pace — even when an unexpected exception arises.
Modern IT environments are multilayered and distributed in nature, posing a huge challenge for the teams in charge of supporting them. Monitoring the various components comprising an application’s architecture is extremely time and resource consuming. The ELK Stack provides organizations with a solution that's focused on gaining insight into and information about an application running on any type of infrastructure:
While Elasticsearch was initially designed for full-text search and analysis, recent trends show a secondary use for metrics analysis. These metrics can communicate performance benchmarks for each component in the application’s landscape.
Application performance monitoring (APM) is one of the most common methods used by engineers today to measure the availability, response times, and behavior of applications and services. As part of the ELK Stack, Elastic APM allows engineers to track key performance-related information such as requests, responses, database transactions, and errors.
Security has always been crucial for organizations and is driven by compliance requirements (HIPAA, PCI, SOC, FISMA, etc.) and the threat of unexpected attacks. Log data contains a wealth of valuable information on what is actually happening with an application in real time. As a result, the ELK Stack should be recognized as a tool that benefits compliance and security teams.
Some key aspects that can be realized from ELK Stack adoption:
Application monitoring is far more than reviewing and analyzing logs. Time is no longer a luxury when an exception is impacting the state of an application — regardless of whether the issue exists in development, staging, testing, or production environments. Any application monitoring solution should maintain an open design and build upon proven technologies. The solution itself should be easy to use and require a low learning curve. The end goal should be simple: provide teams with the ability to become aware of any issues or unexpected behavior within minutes if not seconds.
The ELK Stack elevates application monitoring to a new level by providing a reliable and scalable design to aggregate data from multiple sources. Once stored, the data can be analyzed and observed in real time and via powerful dashboards. The ELK Stack extends its value to organizations through these additional use cases:
Those planning to adopt an application monitoring solution should make sure to include the ELK Stack among any solutions and frameworks that are being considered.
ADVERTISE
CONTRIBUTE ON DZONE
LEGAL
CONTACT US
Let's be friends: