
What is a Supply Chain Control Tower?
Use Python to optimize your supply chain network with an automated control tower to track your shipments and avoid late deliveries.
A supply chain control tower is traditionally defined as a set of dashboards connected to various systems using data to monitor critical events across the supply chain.
As a data scientist, can you automate analyses using Python?
It enables a supply chain department to track better, understand, and resolve critical issues in real-time.
In this article, we will implement an automated control tower with Python that automatically sends incident reports, follows open shipments and analyzes lead times.
SUMMARY
I. How to Use Python to Build an Automated Supply Chain Control Tower?
Let us define a Supply Chain Control Tower for a fashion retailer
 1. Scenario
 Distribution planning for a Fashion Retail company
 2. Shipment Tracking Solution
 Monitor deliveries and automate diagnostics of process failures
II. How Shipment Tracking with Python Can Improve Your Supply Chain
Let us define all the components of our automate control tower
 1. Cut-off Times: Why They Matter for Effective Supply Chain Monitoring
 2. Analyzing Shipments: How to Ensure On-Time Delivery
 3. Analysis of delivered shipments: How to Identify and Mitigate Risk
 4. Analysis of shipments in transit
III. Next Steps: Advanced Analytics for Supply Chain Optimization
We can go beyond monotoring and diagnostics with advacned analytics
 1. Supply Chain Control Tower Powered by GPT: Generative AI
 2. Automating Supply Chain Reports: Python for Faster Decision-Making
 3. Supply Chain Analytics: The Future of Data-Driven Decision Making
How to Use Python to Build an Automated Supply Chain Control Tower?
Scenario
You are a data scientist in an international clothing group with stores worldwide.
You support the distribution planning manager in implementing performance management tools.
Stores Replenishment
Distribution planners manage the inventory in the stores to meet demand.
When the inventory level reaches the minimum level
- Distribution planners create replenishment orders in the ERP with item quantities and requested delivery dates
- Warehouse operational teams prepare the orders for shipment
- Transportation teams organize the delivery to the stores
How do we monitor deliveries?
Shipment Tracking Solution
Daily, you need to follow the shipments and report incidents to the store and logistic managers:
- How many shipments have been delivered with a delay?
- Where are the shipments currently in transit?
- How many transit shipments are at risk?
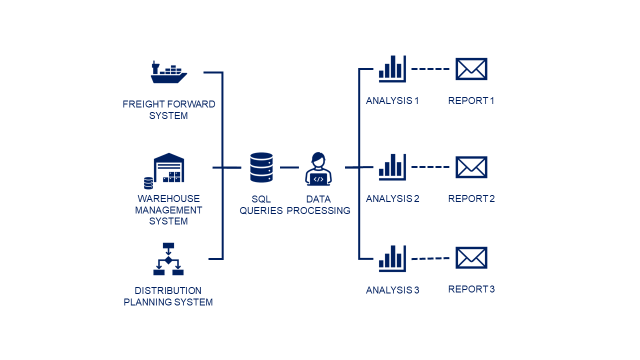
Our Supply Chain Control Tower will be a set of automated Python scripts that distribute reports by email, answering these questions.
- Step 1: Perform SQL queries to extract the shipment information from the systems using pandas.read_sql
- Step 2: Process the data and build visuals using pandas and matplotlib
- Step 3: Create HTML reports and send them by email using smtplib
Let’s implement it with Python.
How Shipment Tracking with Python Can Improve Your Supply Chain
Cut-off Times: Why They Matter?
There are several steps between the order creation in the system and the store delivery managed by different teams.
- Order transmission to the warehouse system: IT Teams
- Order preparation in the warehouse: Warehouse Ops
- Transportation from the Warehouse to the store: Transportation Ops
For some key steps, we have cut-off times.
If they are not respected, +24 hours are added to the total lead time.
What’s the objective? On-time delivery
Analyzing Shipments: How to Ensure On-Time Delivery
After performing the SQL queries, you have a data set of shipment information with all the time stamps needed
- Last Status: The last step of the process at the time you perform the extraction
- On-Time Flags: boolean variable checking if the cut-off time has been respected
Analysis of delivered shipments: How to Identify and Mitigate Risk
How many shipments have been delivered after the requested delivery date?
- On-Time Deliveries: The actual delivery time is before the requested delivery time
- Late Deliveries: The actual delivery time is after the requested delivery time
💡 On-time Definition(s)
You can use different definitions depending on the Incoterms or the team’s performance you want to assess.
- On-time delivery measures the performance of the warehouse and transportation team as it stops when the trucks arrive at the store.
- On-time receiving measures the overall logistics performance as it includes the receiving at the store: it stops when the items are accepted in the system and ready to be sold
- On-time shipment stops at the shipping time from the warehouse: it measures the efficiency of your warehouse operations.
For more information about On Time In Full definition,
Question 1: How many shipments have been delivered with delay?
![👁 Late Deliveries Donut Plot - (Image by Author) [Create Donut Plot with Python: Tutorial]](https://contributor.insightmediagroup.io/wp-content/uploads/2022/09/1l-UfaogFGXIzP8wubb5RHQ.png)
💡 ANALYSIS
1,842 shipments delivered with delay
- 696 due to order transmission issues
- 60 due to warehouse operational issues
- 630 impacted by transportation
- 456 due to multiple factors
🧮 PYTHON CALCULATION
- Filter the shipments to take only the delivered ones
- Groupby Last Status: count the number of shipments
- Pandas pie plotThis visual can be used to animate performance reviews with all the teams
- Transmission Issues: ask your infrastructure and network team the root cause(s) of these issues and follow up with their action plans
- Delivery Issues: align with last-mile transportation teams and store managers to improve coordination and avoid late arrival
What if we want to visualize the past?
Shipments Status by Day
![👁 Stacked Bar Plot Chart of Status per Order Day - (Image by Author) [Create Stacked Bar Plot with Python: Tutorial]](https://contributor.insightmediagroup.io/wp-content/uploads/2022/09/1rZUj2LxCjAq2xuw-8iODkQ.png)
For instance, if you need to deliver important shipments, this visual can be used as a daily follow-up tool to motivate operational teams.
- Push warehouse operational teams to clear the backlog of orders with the status PickPack.
Analysis of shipments in transit
Shipments in transit are the ones that have been ordered but have not yet been delivered to the store.
Question 2: Where are the shipments currently in transit?
💡 COMMENT
2,046 shipments in transit
- 782 in the warehouse
- 593 on flight transit
- 535 in customs
- 136 on last mile delivery
🧮 PYTHON CALCULATION
- Filter the shipments to take only the not delivered one
- Groupby Last Status: count the number of shipments
- Pandas pie plotQuestion 3: How many transit shipments are at risk?
Definition
A shipment in transit is considered at risk if it misses the cut-off time or is delayed for at least one step of the whole chain.
In the example below, your shipment left the warehouse behind schedule. Therefore, it is considered at risk of being delivered late.
💡 COMMENT
1,099 shipments in transit at risk because of delay
- During Warehouse Operations : 534 shipments
- During the flight : 144 shipments
- Due to multiple factors : 421 shipments
🧮 PYTHON CALCULATION
- Filter the shipments to take only the not delivered one with at least on OnTime flag False
- Map the shipments with reascon code: if the flag XX OnTime = False the reason code is XX
- If you have multiple reasons the reason code is Multi
- Groupby Reason code: count the number of shipments
- Pandas pie plot💡 Important Shipments for Collection Launch
If you launch a new collection, you may put extra attention on these shipments at risk and push the teams to accelerate the process.
- Using express delivery for the last mile instead of standard transportation
- Prioritise the orders for picking at the warehouse
What can impact your end-to-end lead times? Variability in your processes
What if you have some variability in the different processes of your delivery chain?
Ideally, your delivery lead time would be 72 hours if all the processes’ lead times respect the targets.
However, introducing some variability can confuse the different cut-off times in the chain and create delivery delays.
For instance, your warehouse has a workforce shortage, and some orders are prepared in 5 hours.
These orders will miss the cut-off time of 19:00:00, and the truck will leave without them.
You’ll have to wait 24 hours to ship them from your DC.
For more details,
Next Steps: Advanced Analytics
Don’t let late deliveries and shipping issues slow down your supply chain.
With the power of Python, you can easily automate your supply chain control tower and monitor your shipments.
Optimizing your logistics processes and analyzing data can improve your supply chain’s overall efficiency and success.
Do you want to automate the distribution of reports?
Automating Supply Chain Reports
Would you automatically send the above visuals in a clean HTML email with the comment area?
A solution for this is presented in an article published a few days ago.
You must plug your tool into the script in the GitHub repository shared in this article.
This method uses the SMTP library of Python with a simple HTML template.
For more details,
Automate Operational Reports Distribution in HTML Emails using Python
Let’s go beyond diagnostic analytics with a prescriptive approach.
What should we do to optimize XX?
Supply Chain Analytics
The Future of Data-Driven Decision Making.
Supply Chain Analytics can be represented as a set of tools that use information flow to answer questions and support the decision-making process.
You’ll need specific methodology, mathematical concepts, and analytics tools to answer each type of question.
A Supply Chain Tower can be included in the descriptive and diagnostic analytics as it helps.
- Monitor and visualise late deliveries
- Initiate a root cause analysis using the time stamps per process
For the following steps, you can use
- Prescriptive models to improve processes, optimize your network or improve your planning rules using Python.
- Predictive models to forecast your sales and allocate resources in advance
For more details,
About Me
Let’s connect on LinkedIn and Twitter. I am a Supply Chain Engineer who uses data analytics to improve logistics operations and reduce costs.
For consulting or advice on analytics and sustainable supply chain transformation, feel free to contact me via Logigreen Consulting.
If you are interested in Data Analytics and Supply Chain, look at my website.
💌 New articles straight to your inbox for free: Newsletter
📘 Your complete guide for Supply Chain Analytics: Analytics Cheat Sheet
Share This Article
Towards Data Science is a community publication. Submit your insights to reach our global audience and earn through the TDS Author Payment Program.
Write for TDS