
What is Regularization: Bias-Variance Tradeoff
Good practice to improve the prediction with unseen data
When we talk about prediction using machine learning models, it’s important to understand prediction errors (i.e., bias and variance). The goal of any machine learning model is to find a model that minimizes the prediction errors on unseen data. There’s a tradeoff of a model’s ability to minimize prediction errors between bias and variance. Understanding these concepts would help us address the issues of overfitting and underfitting.
What is Bias?
When we’re developing a model, we can get separate predictions on the target with the trained model. For example, a Bayesian linear regression can make repeated predictions using all possible regression weights, which follow multivariate Gaussian distribution. Therefore, for a given model, we might have a set of different predicted values.
In figure 1, let’s imagine that the center of the red target is the true output value. With the trained model, we can produce predictions within the blue circle, so the center of the blue circle represents the average predicted value.
Bias is the difference between the average prediction of our model and the true value that we are trying to predict.
The Bias tells us the capacity of the trained model to predict the true target. The lower the bias, the more capable a given trained model is.
What is Variance?
In figure 1, imagine that the radius of the blue circle represents the variance of the predicted values.
Variance is a measure of the variability (aka, spread) of the predicted values for a given input with the trained model.
The lower the variance, the more precisely a trained model can make predictions.
What is an Irreducible Error?
Besides bias and variance, the third type of error is called irreducible error.
The irreducible error represents noise in the data that can’t be explained by the trained model. It always exists regardless of how good the trained model is.
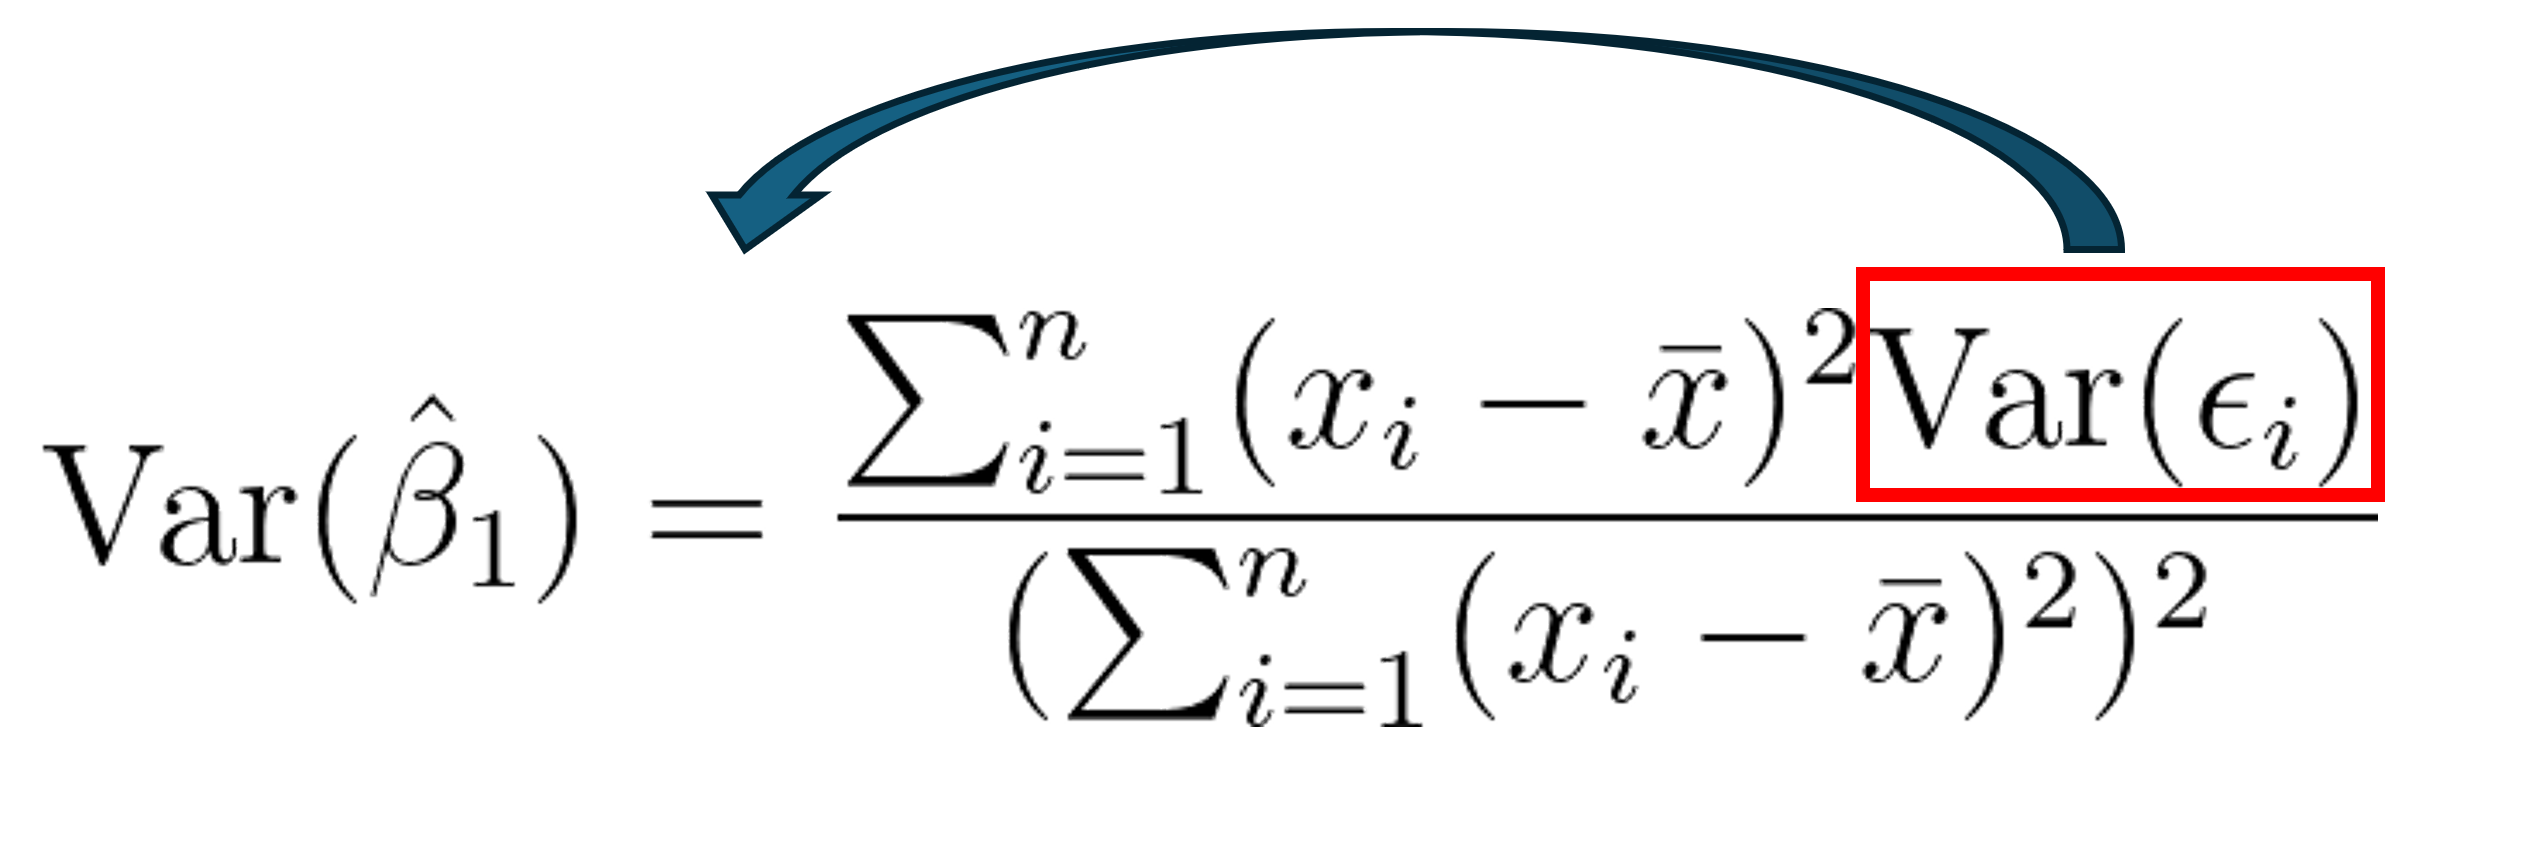
Prediction Error is the sum of Variance, Bias, and Irreducible Error
Let’s prove it mathematically.
What is underfitting?
Underfitting occurs when a model can’t capture and generalize the underlying trend of the data. Intuitively, it didn’t fit the data well enough, as a result, it would produce high errors on both training and testing data (i.e., high bias).
The cause of underfitting could be
- the lack of data (e.g., a small amount of training data, unavailability of key explanatory variables) to develop a model.
- the underlying model is NOT capable of capturing the patterns in the data (e.g., using a linear model with nonlinear data)
What is overfitting?
On the other hand, overfitting occurs when a model is fitting the training too well and it starts to model the noise of the training data. It would have a low error in training data (i.e., low bias) but a high error in the testing data (i.e., high variance)
The cause of overfitting could be
- due to an excessively complicated model which includes too many variables or includes problematic variables, such as higher-order polynomial variables, irrelevant variables, variables that are highly correlated, or variables that are affected by the response variable simultaneously.
- overtraining of a model. For example, training a decision tree without explicit stopping criteria is prone to overfitting.
Bias-Variance Tradeoff
Ideally, we would like to reduce both bias and variance of a model. However, it is very difficult and sometimes impossible to achieve. As you’re trying to reduce the prediction error on the training data, the prediction error on the testing data might increase. Bias and variance oftentimes are moving in opposite directions.
When developing a model with the training data, it is very easy to fit a complex model to make predictions with small bias, but might not create an optimal result due to the high prediction variance on the testing data.
Alternatively, we can explore the trade-off between bias and variance, where it might be better off accepting some bias for a reduction of variance. Consequently, we would have smaller prediction errors on the unseen data.
What is Regularization?
Regularization is a concept to implement the trade-off of the bias and variance that helps to reduce the prediction error. Let’s talk about some of the common techniques of regularization.
Type 1: Modify the Cost Function
In a linear regression model, we can change the cost function to build different models that implement regularization.
For example, In a Ridge Regression model, we modify the cost function to be
In a Lasso Regression model, we modify the cost function to be
In an Elastic-net Regression model, we modify the cost function to be
These three variants of linear regression are associated with Regularization, which penalizes the flexibility and complexity of a model to prevent the risk of overfitting.
Here λ is a hyper-parameter that determines how much flexibility a model would be penalized. The higher the value of λ, the more constraint is applied to the weight of each feature, as a result, it prevents the weights from getting too big and hence avoids overfitting. However, if the value of λ is too high, it might create the issue of underfitting because the weights of key explanatory variables become too small and it can’t accurately explain the response variable.
We can find the optimal value of λ using K-Fold Cross-Validation (which we will cover later).
Type 2: K-Fold Cross-Validation
K-Fold Cross-Validation is another popular tool used in training a machine learning model. The idea of this method is simple, we create a multiple set of training data from the observed data, then train the model and evaluate the model based on the validation data, which is similar to evaluating the model on the unseen data. It includes the following steps,
Step 1: We split the observed data into training data and testing data (e.g., 1:9 split, sometimes stratification is required). Then we put the training data into the training fold and validation fold randomly. For example, in 5-fold cross-validation, we would have 5 sets of training data and validation data.
Step 2: In each set, we train the model using the data from the training fold and evaluate the model performance on the validation fold. Using validation fold to evaluate the model mimics the real-world application of the ML model (i.e., out-of-sample prediction or prediction on unseen data). Then we end up with K performance results.
Step 3: For a given trained model, we compute the overall performance score by averaging K performance results.
Step 4: Pick the trained model with the best overall performance score and apply the model to the testing data to compute the performance score.
The performance score in the testing data should be close to the overall performance score. If it is worse, then we need to dive deeper into the data and investigate the discrepancy.
Type 3: Modify the ML Algorithm
Another way to avoid overfitting is simply changing the machine learning algorithm. For example, an overgrown decision tree is prone to overfitting. To address that, we can use a random forest with a predefined max tree depth. In the case of training a neural network, we can apply the dropout method to ensure the model can generalize the patterns with random subsets of the selected nodes.
Final Notes
To train a machine learning model with minimal prediction errors, we need to make sure that we explore the trade-off between bias and variance. Regularization is an important step we need to consider when developing a model.
Here are some related posts you can explore if you’re interested in Linear Regression and Causal Inference.
- Causal Inference: Econometric Models vs. A/B Testing
- Linear Regression vs. Logistic Regression: OLS, Maximum Likelihood Estimation, Gradient Descent
- Linear Regression with OLS: Unbiased, Consistent, BLUE, Best (Efficient) Estimator
- Causal Inference with Linear Regression: Omitted variables and Irrelevant variables
- Causal Inference with Linear Regression: Endogeneity
- Linear Regression with OLS: Heteroskedasticity and Autocorrelation
Thank you for reading !!!
If you enjoy this article and would like to Buy Me a Coffee, please click here.
You can sign up for a membership to unlock full access to my articles, and have unlimited access to everything on Medium. Please subscribe if you’d like to get an email notification whenever I post a new article.
Share This Article
Towards Data Science is a community publication. Submit your insights to reach our global audience and earn through the TDS Author Payment Program.
Write for TDS