
Analyze and Apply Statistical Methods Using Minitab
Keep adding new skills with 10,000+ programs for $239 (usually $399). Save now.
Analyze and Apply Statistical Methods Using Minitab
This course is part of Minitab Applied Statistics & Hypothesis Testing Mastery Specialization
Included with
Ask Coursera
Recommended experience
Recommended experience
What you'll learn
Analyze datasets and interpret statistical results using Minitab tools.
Apply inferential methods, hypothesis testing, and regression analysis.
Evaluate measurement systems and monitor process performance with control charts.
Skills you'll gain
- Sampling (Statistics)
- Performance Analysis
- Process Capability
- Statistical Analysis
- Data Analysis
- Descriptive Statistics
- Process Analysis
- Exploratory Data Analysis
- Probability Distribution
- Data Visualization
- Statistical Hypothesis Testing
- Plot (Graphics)
- Probability & Statistics
- Statistical Process Controls
- Statistical Visualization
- Statistical Methods
- Statistics
- Statistical Modeling
Tools you'll learn
Details to know
February 2026
16 assignments
See how employees at top companies are mastering in-demand skills
Build your subject-matter expertise
- Learn new concepts from industry experts
- Gain a foundational understanding of a subject or tool
- Develop job-relevant skills with hands-on projects
- Earn a shareable career certificate
There are 4 modules in this course
By the end of this course, learners will be able to analyze datasets, interpret statistical results, apply inferential methods, evaluate measurement systems, and monitor process performance using Minitab. Learners will develop the ability to select appropriate statistical tools, validate assumptions, and make data-driven decisions across quality, engineering, and business contexts.
This course provides a structured, end-to-end journey through statistical analysis using Minitab, starting from foundational concepts such as data types, descriptive statistics, and data visualization, and progressing to probability distributions, sampling, hypothesis testing, regression, and process control. Through step-by-step demonstrations aligned with real-world scenarios, learners gain both conceptual clarity and practical proficiency. What makes this course unique is its progressive, practice-oriented design that bridges beginner concepts to advanced applications such as Measurement System Analysis (MSA), Process Capability Analysis, ANOVA, and Control Charts. Each topic is carefully sequenced to build confidence while reinforcing analytical thinking. Whether learners are new to statistics or seeking to strengthen their applied skills, this course equips them with industry-relevant statistical competence using Minitab.
This module introduces learners to the fundamentals of statistical analysis using Minitab, focusing on data types, descriptive statistics, and essential visualization techniques for effective data interpretation.
What's included
9 videos4 assignments
9 videos•Total 56 minutes
- Introduction to Minitab•5 minutes
- Types of Data•10 minutes
- Measure of Dispersion•3 minutes
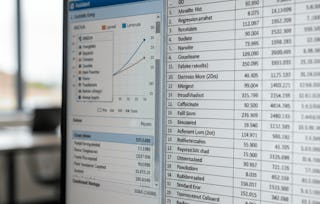
- Descriptive Stats•10 minutes
- Data Sorting•5 minutes
- Histograms•5 minutes
- Pie Charts•9 minutes
- Bar Charts•5 minutes
- Line Graphs•4 minutes
4 assignments•Total 60 minutes
- Graded-Foundations of Statistical Thinking with Minitab•30 minutes
- Getting Started with Data•10 minutes
- Understanding and Organizing Data•10 minutes
- Visualizing Data Clearly•10 minutes
This module builds analytical skills by exploring data relationships, probability distributions, and sampling concepts to support sound statistical reasoning and data preparation.
What's included
9 videos4 assignments
9 videos•Total 63 minutes
- Scatter plots•4 minutes
- Box Plot•4 minutes
- Discrete Random Variable•11 minutes
- Binomial Distribution•9 minutes
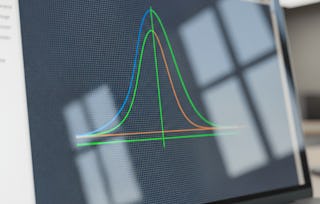
- Normal Distribution•10 minutes
- Normality Test•6 minutes
- Data Transformation•6 minutes
- Sampling and Sample Size•6 minutes
- Sample Size for Estimation•8 minutes
4 assignments•Total 60 minutes
- Graded-Exploring Data Patterns and Distributions•30 minutes
- Relationships and Spread•10 minutes
- Probability Distributions Made Simple•10 minutes
- Preparing Data for Analysis•10 minutes
This module focuses on inferential statistics, measurement system evaluation, and hypothesis testing to enable data-driven decision-making in quality and process improvement.
What's included
9 videos4 assignments
9 videos•Total 81 minutes
- Parameter Estimation•9 minutes
- Power Analysis•12 minutes
- Measurement System Analysis•8 minutes
- MSA Gage R and R•4 minutes
- MSA Attribute Agreement Analysis•11 minutes
- Process Capability Analysis•10 minutes
- Hypothesis Testing•11 minutes
- Hypothesis Testing Mean•8 minutes
- Paired-T Test•8 minutes
4 assignments•Total 60 minutes
- Graded-Statistical Inference and Measurement Systems•30 minutes
- Estimation and Power•10 minutes
- Measurement System Validation•10 minutes
- Foundations of Hypothesis Testing•10 minutes
This module equips learners with advanced statistical tools for comparing groups, modeling relationships, and monitoring process performance using control charts.
What's included
7 videos4 assignments
7 videos•Total 57 minutes
- Anova•5 minutes
- Pareto Analysis•8 minutes
- Correlation•7 minutes
- Regression•5 minutes
- Regression Continue•11 minutes
- Control Charts•11 minutes
- P-Chart•10 minutes
4 assignments•Total 60 minutes
- Graded-Advanced Analysis and Process Control•30 minutes
- Comparing and Prioritizing Data•10 minutes
- Understanding Relationships•10 minutes
- Monitoring and Controlling Processes•10 minutes
Earn a career certificate
Add this credential to your LinkedIn profile, resume, or CV. Share it on social media and in your performance review.
Explore more from Data Analysis
- Status: Free Trial
Course
- Status: Free Trial
- Status: Free Trial
Specialization
- Status: Free Trial
Why people choose Coursera for their career
Frequently asked questions
To access the course materials, assignments and to earn a Certificate, you will need to purchase the Certificate experience when you enroll in a course. You can try a Free Trial instead, or apply for Financial Aid. The course may offer 'Full Course, No Certificate' instead. This option lets you see all course materials, submit required assessments, and get a final grade. This also means that you will not be able to purchase a Certificate experience.
When you enroll in the course, you get access to all of the courses in the Specialization, and you earn a certificate when you complete the work. Your electronic Certificate will be added to your Accomplishments page - from there, you can print your Certificate or add it to your LinkedIn profile.
Yes. In select learning programs, you can apply for financial aid or a scholarship if you can’t afford the enrollment fee. If fin aid or scholarship is available for your learning program selection, you’ll find a link to apply on the description page.
More questions
Financial aid available,