
3D Data Visualization for Science Communication
Ends soon! Keep adding new skills with 10,000+ programs for $239 (usually $399). Save now.
3D Data Visualization for Science Communication
Instructors: Kalina Borkiewicz
5,019 already enrolled
Included with
Skills you'll gain
Tools you'll learn
Details to know
See how employees at top companies are mastering in-demand skills
There are 6 modules in this course
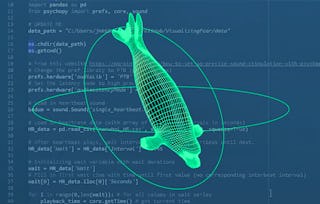
This course is an introduction to 3D scientific data visualization, with an emphasis on science communication and cinematic design for appealing to broad audiences. You will develop visualization literacy, through being able to interpret/analyze (read) visualizations and create (write) your own visualizations.
By the end of this course, you will: -Develop visualization literacy. -Learn the practicality of working with spatial data. -Understand what makes a scientific visualization meaningful. -Learn how to create educational visualizations that maintain scientific accuracy. -Understand what makes a scientific visualization cinematic. -Learn how to create visualizations that appeal to broad audiences. -Learn how to work with image-making software. (for those completing the Honors track)
You will become familiar with the course, your classmates, and our learning environment.
What's included
1 video5 readings1 assignment1 discussion prompt1 plugin
1 video•Total 3 minutes
- Welcome to 3D Scientific Data Visualization!•3 minutes
5 readings•Total 50 minutes
- Syllabus•15 minutes
- About the Discussion Forums•5 minutes
- Online Education at Gies College of Business•10 minutes
- Updating Your Profile•10 minutes
- Social Media•10 minutes
1 assignment•Total 15 minutes
- Orientation Quiz•15 minutes
1 discussion prompt•Total 30 minutes
- Getting to Know Your Classmates•30 minutes
1 plugin•Total 15 minutes
- New Plugin Item•15 minutes
Week 1 is an introduction to the field of data visualization, as well as related fields like computational science and computer graphics. You will learn about different types of data visualization, and visualization best practices.
What's included
8 videos3 assignments2 peer reviews1 plugin
8 videos•Total 67 minutes
- Introduction to Scientific Visualization•8 minutes
- Visualization Pipeline•8 minutes
- Computational Science•7 minutes
- Computer Graphics•8 minutes
- Rendering•7 minutes
- Moving Pictures•7 minutes
- Critiquing Visualization•10 minutes
- Data and Visualization Ethics•12 minutes
3 assignments•Total 105 minutes
- Week 1 Quiz 1: What Is Visualization?•30 minutes
- Week 1 Quiz 2: Components of Scientific Visualization•45 minutes
- Week 1 Quiz 3: What Makes a Good Visualization?•30 minutes
2 peer reviews•Total 120 minutes
- Week 1 Conceptual Assignment•30 minutes
- Week 1 Hands On Assignment•90 minutes
1 plugin•Total 15 minutes
- Visualization Playground•15 minutes
Week 2 is all about data - how are spatial data represented in a computer? How is it formatted? Where can you find it, and how do you work with it?
What's included
9 videos4 assignments2 peer reviews
9 videos•Total 69 minutes
- Virtual Coordinates•6 minutes
- 3D Geometry•7 minutes
- Data Representation•12 minutes
- Finding and Using Data•4 minutes
- Computational Resources•6 minutes
- Optimization•10 minutes
- Software•8 minutes
- Transformations and Attributes•6 minutes
- Programming•9 minutes
4 assignments•Total 165 minutes
- Week 2 Quiz 1: What Scientific Data Looks Like•45 minutes
- Week 2 Quiz 2: Working with Data•30 minutes
- Week 2 Quiz 3: How to Approach Loading Data into a New Tool•30 minutes
- Week 2 Hands On Assignment: Part 1•60 minutes
2 peer reviews•Total 270 minutes
- Week 2 Conceptual Assignment•30 minutes
- Week 2 Hands On Assignment: Part 2•240 minutes
Week 3 is all about the human side of things. How do people learn? How do we perceive visual information? What makes certain methods of communication and education more effective? How do you find a story in a dataset, and how do you tell that story clearly and concisely?
What's included
9 videos3 assignments2 peer reviews
9 videos•Total 94 minutes
- Storytelling•13 minutes
- Education•12 minutes
- Color•11 minutes
- Vision and Cameras•9 minutes
- Driving Visual Features with Data•12 minutes
- Abstraction and Representation•10 minutes
- Data Artifacts•8 minutes
- Previsualization•10 minutes
- Derived Data•9 minutes
3 assignments•Total 135 minutes
- Week 3 Quiz 1: Understanding Humans•45 minutes
- Week 3 Quiz 2: Designing for Human Perception•45 minutes
- Week 3 Quiz 3: Refining Data•45 minutes
2 peer reviews•Total 240 minutes
- Week 3 Conceptual Assignment•60 minutes
- Week 3 Hands On Assignment•180 minutes
Week 4 is about presenting your visualization in an engaging way to broad audiences with techniques like camera design, lighting, compositing, digital cosmetics, and other tricks from Hollywood. You’ll also learn how to package your visualization with sound, titles, and credits, and you’ll learn how to distribute it to various types of audiences.
What's included
8 videos3 assignments2 peer reviews
8 videos•Total 77 minutes
- Camera Design•15 minutes
- Display Environments•6 minutes
- Lighting•10 minutes
- Designing Around the Data•7 minutes
- Image Artifacts•7 minutes
- Editing and Compositing•14 minutes
- Narration and Sound•10 minutes
- Packaging and Distribution•7 minutes
3 assignments•Total 105 minutes
- Week 4 Quiz 1: Action, Camera, Lights!•45 minutes
- Week 4 Quiz 2: Digital Cosmetics•30 minutes
- Week 4 Quiz 3: Finishing Touches•30 minutes
2 peer reviews•Total 360 minutes
- Week 4 Conceptual Assignment•120 minutes
- Week 4 Hands On Assignment•240 minutes
Congratulations on reaching the end of the course!
What's included
1 video1 reading1 plugin
1 video•Total 1 minute
- Closing•1 minute
1 reading•Total 10 minutes
- Course Credits•10 minutes
1 plugin•Total 15 minutes
- End of Course Survey•15 minutes
Instructors
Explore more from Data Analysis
- Status: PreviewU
University of California, Santa Cruz
Course
- Status: PreviewI
Illinois Tech
Course
- Status: Preview
Course
- Status: Free TrialU
University of Colorado Boulder
Course
Why people choose Coursera for their career
Frequently asked questions
To access the course materials, assignments and to earn a Certificate, you will need to purchase the Certificate experience when you enroll in a course. You can try a Free Trial instead, or apply for Financial Aid. The course may offer 'Full Course, No Certificate' instead. This option lets you see all course materials, submit required assessments, and get a final grade. This also means that you will not be able to purchase a Certificate experience.
When you purchase a Certificate you get access to all course materials, including graded assignments. Upon completing the course, your electronic Certificate will be added to your Accomplishments page - from there, you can print your Certificate or add it to your LinkedIn profile.
Yes. In select learning programs, you can apply for financial aid or a scholarship if you can’t afford the enrollment fee. If fin aid or scholarship is available for your learning program selection, you’ll find a link to apply on the description page.
More questions
Financial aid available,
¹ Some assignments in this course are AI-graded. For these assignments, your data will be used in accordance with Coursera's Privacy Notice.