
Excel: Dashboards and Geospatial Visualizations
Keep adding new skills with 10,000+ programs for $239 (usually $399). Save now.
Excel: Dashboards and Geospatial Visualizations
This course is part of Data Analysis and Visualization with Microsoft Excel Specialization
Instructor: Bill Rosenthal
Included with
Ask Coursera
What you'll learn
In this course, you will present visual insights with dashboards and create geospatial visualizations in Excel.
Skills you'll gain
Details to know
January 2026
1 assignment
See how employees at top companies are mastering in-demand skills
Build your subject-matter expertise
- Learn new concepts from industry experts
- Gain a foundational understanding of a subject or tool
- Develop job-relevant skills with hands-on projects
- Earn a shareable career certificate
There are 3 modules in this course
In this course, you'll continue to develop your data-analysis skills in Excel by presenting visual insights with dashboards. You'll also create geospatial visualizations in Excel.
This is the third course in a multi-course Specialization. All of the courses in this Specialization require that you have a recent version of Microsoft Excel installed. The course setup instructions provided in the first course go into more detail about the hardware and software requirements.
PivotTables provide the raw power and ease of use that allow you to perform iterative data analysis to determine important insights and trends in data, but you still have to communicate those findings in a way that is compelling and easy to understand.
What's included
1 reading5 plugins
1 reading•Total 5 minutes
- ⚠️READ THIS FIRST⚠️•5 minutes
5 plugins•Total 115 minutes
- Lesson Introduction•5 minutes
- Visualize Data with PivotCharts•35 minutes
- Filter Data Using Slicers and Timelines•35 minutes
- Create a Dashboard in Excel•35 minutes
- Lesson Summary•5 minutes
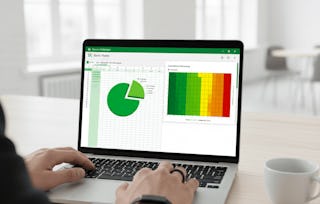
Often, images can tell a story or provide insight in an instantaneous fashion that isn't always possible with words and numbers. When presenting complex relationships among various bits of data to large groups of people, you may find it easier to display a chart or a map instead of asking the audience to pore over massive amounts of data to see your point.
What's included
4 plugins
4 plugins•Total 40 minutes
- Lesson Introduction•5 minutes
- Create Map Charts in Excel•15 minutes
- Customize Map Charts in Excel•15 minutes
- Lesson Summary•5 minutes
You'll wrap things up and then validate what you've learned in this course by taking an assessment.
What's included
1 reading1 assignment
1 reading•Total 5 minutes
- Course Summary•5 minutes
1 assignment•Total 10 minutes
- Course Assessment•10 minutes
Earn a career certificate
Add this credential to your LinkedIn profile, resume, or CV. Share it on social media and in your performance review.
Instructor
Offered by
Explore more from Business Essentials
- Status: Free Trial
- Status: Free Trial
Course
- Status: Free TrialL
Logical Operations
Course
- Status: Free Trial
Course
Why people choose Coursera for their career
Frequently asked questions
To access the course materials, assignments and to earn a Certificate, you will need to purchase the Certificate experience when you enroll in a course. You can try a Free Trial instead, or apply for Financial Aid. The course may offer 'Full Course, No Certificate' instead. This option lets you see all course materials, submit required assessments, and get a final grade. This also means that you will not be able to purchase a Certificate experience.
When you enroll in the course, you get access to all of the courses in the Specialization, and you earn a certificate when you complete the work. Your electronic Certificate will be added to your Accomplishments page - from there, you can print your Certificate or add it to your LinkedIn profile.
Yes. In select learning programs, you can apply for financial aid or a scholarship if you can’t afford the enrollment fee. If fin aid or scholarship is available for your learning program selection, you’ll find a link to apply on the description page.
More questions
Financial aid available,