
Microsoft Excel: Data Analysis with Power Pivot
Keep adding new skills with 10,000+ programs for $239 (usually $399). Save now.
Microsoft Excel: Data Analysis with Power Pivot
This course is part of Microsoft Excel 365: From Zero to Mastery Specialization
Instructor: Bill Rosenthal
Included with
Ask Coursera
What you'll learn
In this course, you will use Power Pivot along with Excel to analyze data from a variety of sources.
Skills you'll gain
- Data Visualization Software
- Key Performance Indicators (KPIs)
- Spreadsheet Software
- Performance Reporting
- Performance Measurement
- Trend Analysis
- Cloud-Based Integration
- Data Analysis Expressions (DAX)
- Pivot Tables And Charts
- Data Presentation
- Time Series Analysis and Forecasting
- Data Integration
- Data Analysis
- Data Manipulation
- Data Modeling
Tools you'll learn
Details to know
January 2026
1 assignment
See how employees at top companies are mastering in-demand skills
Build your subject-matter expertise
- Learn new concepts from industry experts
- Gain a foundational understanding of a subject or tool
- Develop job-relevant skills with hands-on projects
- Earn a shareable career certificate
There are 4 modules in this course
We are now living in the age of big data. Data is being collected all the time and for increasingly detailed transactions. This can lead to an overwhelming amount of data, which brings about a need for people who can analyze large amounts of data quickly. Fortunately, Microsoft® Excel® provides Power Pivot to help you organize, manipulate, and report on your data in the best way possible. Since a tool is only as good as the person using it, it is important to gain a solid understanding of Power Pivot to maximize your effectiveness when analyzing data.
This material will benefit users of any current Office version. The course environment setup is based on Excel for Office 365. Students taking this course are experienced Excel users who are seeking to advance their data-analysis capabilities by using Power Pivot. In this course, you will: get started with Power Pivot, visualize Power Pivot data, and work with advanced functionality in Power Pivot. This course requires that you have Microsoft Excel installed on a Windows PC. The course setup instructions provided in the first module of the course go into more detail about the hardware and software requirements.
Today's business-intelligence tasks require that you process internal and external data from a wide variety of sources, including the cloud, data services, sales automation tools, Customer Relationship Management systems, and so forth. While there are dedicated business-intelligence applications, many organizations are finding that many of their needs are met using tools provided in Microsoft® Office. You may already use Microsoft® Excel® PivotTables and PivotCharts to create your own reports and data dashboards, but you may have experienced some of Excel's limitations, such as the amount of data you can process and what you can do with data from different sources. Power Pivot overcomes many of these limitations, enabling you to create more sophisticated models and perform powerful data analysis right within the Excel interface. To get started using Power Pivot with Excel, there are some setup tasks you need to perform.
What's included
6 plugins
6 plugins•Total 100 minutes
- Getting Started with This Course•20 minutes
- Lesson Introduction•5 minutes
- Enable and Navigate Power Pivot•30 minutes
- Manage Data Relationships•30 minutes
- Mastery Builder: Getting Started with Power Pivot•10 minutes
- Lesson Summary•5 minutes
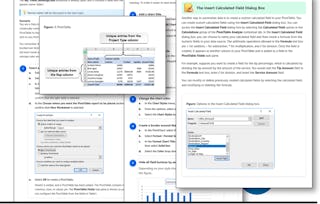
Now that you have Power Pivot enabled and have worked with the Data Model, you are ready to visualize your Power Pivot data into reports such as tables and charts. This enables you to organize data for easier analysis. Once you have created a report, you may realize that you want to view information in a specific way that you don't readily have available in your data. Usually, though, you already have the pieces you need and they just need to be manipulated in a different way. This is where calculations are useful. By using the data you already have and applying calculations to it, you can add data to the Data Model to enhance your reports.
What's included
5 plugins
5 plugins•Total 95 minutes
- Lesson Introduction•5 minutes
- Create a Power Pivot Report•30 minutes
- Create Calculations in Power Pivot•30 minutes
- Mastery Builder: Visualizing Power Pivot Data•15 minutes
- Lesson Summary•15 minutes
Now that you have created a report from your Power Pivot data and created basic calculations for use in PivotTables, you are ready to work with more advanced functionality. Often when you analyze data, you are measuring performance by comparing it to some sort of goal or target. Additionally, you are often comparing data over time to measure performance or to find trends. Can Microsoft® Excel® help you with these tasks? Fortunately, Power Pivot includes specific functionalities to help you measure performance and analyze data over time.
What's included
5 plugins
5 plugins•Total 95 minutes
- Lesson Introduction•5 minutes
- Create a KPI•30 minutes
- Work with Dates and Time in Power Pivot•30 minutes
- Mastery Builder: Working with Advanced Functionality in Power Pivot•15 minutes
- Lesson Summary•15 minutes
You'll wrap things up and then validate what you've learned in this course by taking an assessment.
What's included
1 assignment2 plugins
1 assignment•Total 10 minutes
- Course Assessment•10 minutes
2 plugins•Total 25 minutes
- Appendices•10 minutes
- Course Summary•15 minutes
Earn a career certificate
Add this credential to your LinkedIn profile, resume, or CV. Share it on social media and in your performance review.
Instructor
Offered by
Explore more from Business Essentials
- Status: Free Trial
Course
- Status: Free TrialM
Macquarie University
Course
- Status: Free TrialL
Logical Operations
Course
- Status: Free TrialL
Logical Operations
Course
Why people choose Coursera for their career
Frequently asked questions
To access the course materials, assignments and to earn a Certificate, you will need to purchase the Certificate experience when you enroll in a course. You can try a Free Trial instead, or apply for Financial Aid. The course may offer 'Full Course, No Certificate' instead. This option lets you see all course materials, submit required assessments, and get a final grade. This also means that you will not be able to purchase a Certificate experience.
When you enroll in the course, you get access to all of the courses in the Specialization, and you earn a certificate when you complete the work. Your electronic Certificate will be added to your Accomplishments page - from there, you can print your Certificate or add it to your LinkedIn profile.
Yes. In select learning programs, you can apply for financial aid or a scholarship if you can’t afford the enrollment fee. If fin aid or scholarship is available for your learning program selection, you’ll find a link to apply on the description page.
More questions
Financial aid available,