
Predictive Analytics: Apply, Analyze & Interpret
Predictive Analytics: Apply, Analyze & Interpret
This course is part of Predictive Analytics & Modeling with Minitab Specialization
Included with
Ask Coursera
10 reviews
10 reviews
What you'll learn
Apply predictive modeling and hypothesis testing using Minitab and Excel.
Analyze data with ANOVA, chi-square, and regression techniques.
Interpret statistical outputs to make real-world business decisions.
Skills you'll gain
- Business Analytics
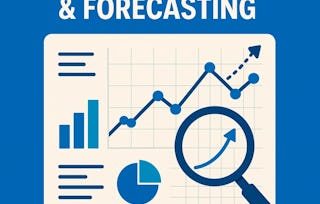
- Forecasting
- Data Analysis Software
- Regression Analysis
- Statistics
- Probability & Statistics
- Analytics
- Quantitative Research
- Statistical Modeling
- Predictive Analytics
- Correlation Analysis
- Analysis
- Data Analysis
- Predictive Modeling
- Statistical Methods
- Advanced Analytics
- Statistical Hypothesis Testing
- Statistical Analysis
Tools you'll learn
Details to know
See how employees at top companies are mastering in-demand skills
Build your subject-matter expertise
- Learn new concepts from industry experts
- Gain a foundational understanding of a subject or tool
- Develop job-relevant skills with hands-on projects
- Earn a shareable career certificate
There are 5 modules in this course
By completing this course, learners will be able to apply predictive modeling, perform hypothesis testing, analyze correlations, and build regression models to interpret complex datasets. They will gain skills in statistical tools such as ANOVA, chi-square, t-tests, and control charts while learning to implement and interpret outputs using Minitab and Excel.
The course equips learners with the ability to identify patterns, evaluate case-based insights, and apply statistical reasoning to real-world data such as customer complaints, loan applicants, health indicators, and financial performance metrics. Through structured modules, learners will progress from foundational concepts in predictive analytics to advanced regression techniques for decision-making. What makes this course unique is its strong emphasis on practical application and interpretation. Each module combines theory with real-world examples, ensuring learners can translate statistical outputs into actionable insights. By the end, learners will not only understand statistical models but also apply them effectively in business, finance, and research settings.
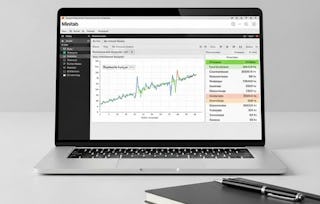
This module introduces the foundations of predictive analytics, covering the basics of predictive modeling and essential statistical tools. Learners will explore regression approaches, ANOVA, and control charts while gaining practical exposure to Minitab for data analysis and interpretation.
What's included
5 videos3 assignments
5 videos•Total 52 minutes
- Introduction of Predictive Modeling•9 minutes
- Non Linear Regression•11 minutes
- Anova and Control Charts•10 minutes
- Understanding, Interpretation and implementation using Minitab•11 minutes
- Continue on Interpretation and implementation using Minitab•11 minutes
3 assignments•Total 50 minutes
- Introduction to Predictive Analytics•30 minutes
- Predictive Modeling Basics•10 minutes
- Essential Statistical Tools•10 minutes
This module emphasizes the importance of observations in analytics. Learners will examine NAV prices, descriptive statistics, and case-based insights such as customer complaints, health data, and loan applicant results to build real-world analytical perspectives.
What's included
8 videos3 assignments
8 videos•Total 74 minutes
- Observation•12 minutes
- Results for NAV Prices•7 minutes
- NAV Prices - Observations•10 minutes
- Descriptive Statistics•8 minutes
- Customer Complaints-Observations•10 minutes
- Resting Heart Rate Observations•9 minutes
- Results for Loan Applicant MTW•10 minutes
- More Details on Results for Loan Applicant MTW•9 minutes
3 assignments•Total 50 minutes
- Data Observations and Results•30 minutes
- General Observations•10 minutes
- Case-Based Insights•10 minutes
This module focuses on hypothesis testing with practical applications of t-tests, ANOVA, and chi-square tests. Learners will understand when to apply different tests and how to interpret results for business and research contexts.
What's included
7 videos3 assignments
7 videos•Total 62 minutes
- Features of T- Test•10 minutes
- Loan Applicant•6 minutes
- Paired T - Test•7 minutes
- Understanding and Implementation of ANOVA•10 minutes
- Pairwise Comparisons•8 minutes
- Features of Chi - Test•11 minutes
- Preference and Pulse Rate•10 minutes
3 assignments•Total 50 minutes
- Hypothesis Testing Applications•30 minutes
- T-Test Applications•10 minutes
- ANOVA and Chi-Square•10 minutes
This module explores correlation concepts, implementation, and interpretation. Learners will study correlation basics, use Minitab for analysis, and apply correlation results to financial and real-world datasets for better decision-making.
What's included
10 videos4 assignments
10 videos•Total 70 minutes
- Diffe. btw Growth Plan ad Dividend Plan in MF•7 minutes
- Checking NAV Price and Repurchase Price•6 minutes
- Basic Correlation Techniques•9 minutes
- More on Basic Correlation Techniques•6 minutes
- CT Implementation Using Minitab•10 minutes
- Continue on Implemetation using Minitab•3 minutes
- Interpretation of Correlation Values•6 minutes
- Results for Return•9 minutes
- Correlation Values - Observations•6 minutes
- Correlation Values - Interpretations•8 minutes
4 assignments•Total 60 minutes
- Correlation Analysis•30 minutes
- Correlation Basics•10 minutes
- Correlation Implementation•10 minutes
- Correlation Results and Interpretations•10 minutes
This module provides a comprehensive study of regression, including basic principles, scatterplots, equations, applications, and advanced insights. Learners will analyze demographic, financial, and scientific datasets to master regression modeling and interpretation.
What's included
25 videos5 assignments
25 videos•Total 190 minutes
- Heart Beat - Objective•6 minutes
- Heart Beat - Interpretation•5 minutes
- Demographics and Living Standards•6 minutes
- Demographics and Living Standards - Observation•6 minutes
- Graphical Implementation•9 minutes
- Add Regression Fit•9 minutes
- Scatterplot with Regression•6 minutes
- Scatterplot of Rhdeq vs Rhcap•5 minutes
- Introduction to Regression Modeling•9 minutes
- Identify Independent Variable•9 minutes
- Regression Equation•8 minutes
- Tabulating the Values•6 minutes
- Interpretation and Implementation on Data Sets•8 minutes
- Continue on Interpretation on Database•9 minutes
- Significant Variable•8 minutes
- Calculating Corresponding Values•9 minutes
- Identify Dependent Variable•9 minutes
- Generate Descriptive Statistics•9 minutes
- Scatterplot of Energy Consumption•7 minutes
- Identity Equation•8 minutes
- P - Value and T - Value•7 minutes
- Changes in Tem. and Expansion•8 minutes
- Objective of Stock Prices•9 minutes
- Interpretations of Example 5•9 minutes
- Reliance Return Change•8 minutes
5 assignments•Total 70 minutes
- Regression Foundations•30 minutes
- Regression Basics•10 minutes
- Scatterplots and Equations•10 minutes
- Regression Applications•10 minutes
- Advanced Regression Insights•10 minutes
Earn a career certificate
Add this credential to your LinkedIn profile, resume, or CV. Share it on social media and in your performance review.
Explore more from Data Analysis
- Status: Free Trial
Specialization
- Status: Preview
Course
- Status: PreviewO
O.P. Jindal Global University
Course
- Status: Free TrialU
University of Colorado Boulder
Course
Why people choose Coursera for their career
Learner reviews
- 5 stars
100%
- 4 stars
0%
- 3 stars
0%
- 2 stars
0%
- 1 star
0%
Showing 3 of 10
Reviewed on Apr 8, 2026
As a beginner this course made predictive analytics simple, helping me apply, analyze and interpret data with confidence and clarity.
Reviewed on Mar 30, 2026
Perfect course for beginners to learn predictive analytics in a simple way.
Reviewed on Mar 28, 2026
Simple and clear course for learning predictive analytics basics and data interpretation.
Advance your career with an online degree
Earn a degree from world-class universities - 100% online
Frequently asked questions
To access the course materials, assignments and to earn a Certificate, you will need to purchase the Certificate experience when you enroll in a course. You can try a Free Trial instead, or apply for Financial Aid. The course may offer 'Full Course, No Certificate' instead. This option lets you see all course materials, submit required assessments, and get a final grade. This also means that you will not be able to purchase a Certificate experience.
When you enroll in the course, you get access to all of the courses in the Specialization, and you earn a certificate when you complete the work. Your electronic Certificate will be added to your Accomplishments page - from there, you can print your Certificate or add it to your LinkedIn profile.
Yes. In select learning programs, you can apply for financial aid or a scholarship if you can’t afford the enrollment fee. If fin aid or scholarship is available for your learning program selection, you’ll find a link to apply on the description page.
More questions
Financial aid available,