
Most Ops and Finance directors don’t have a reporting problem, but a visibility one. The data exists—it's sitting in schedules, timesheets, and project budgets across the team—but there isn’t a view that connects it, updates in real time, and answers the questions that actually matter before a project goes sideways.
Float.com gives you that view.
As Float’s Customer Success Specialist, I’ll be guiding you through a live walkthrough of Float’s reporting features and forecasting functionality, so you know what to look at, when, to make smarter real-time decisions that protect your margins.
What you’ll learn
- Use filters and saved views to surface the right information quickly
- Track budgets, timelines, and utilization in one place
- Compare scheduled vs. logged hours to monitor project performance
- Export, share, and connect your Float data to other workflows
Whether you’re in Ops, Finance, or Delivery, this session helps you move beyond the numbers, so you’re working with the right signals, at the right time, to deliver every project on time and budget.
Watch the walkthrough
Key chapters:
0:00 Intro & setup requirements: I say hello 👋 and share an overview of the session and what you need configured in Float before the reporting features make sense.
1:47 Dashboards: high-level operational and financial signals for admins, plus capacity, utilization, and budget at a glance.
4:49 Schedule view: how to scan for availability across your whole team, filter by department or role, and spot who can take on work.
7:10 Project plan view: monitor margin and budget utilization in real time, compare estimates vs. actuals, and adjust allocations on the fly.
12:43 Reports: tabular breakdowns of people and projects; sort, filter, and chart scheduled vs. logged time.
18:17 Float MCP:ask AI natural language questions about your Float data to quickly pull insights for meetings or planning.
<hr>
If you prefer to read...
In this session, I walked through all the data insights available in Float: where to find them and how to use them to support your decisions. Everything here is from the Account Owner and Admin view. Some of the project finance features need roles, rates, and budgets set up first; if you haven’t done that yet, that’s the place to start.
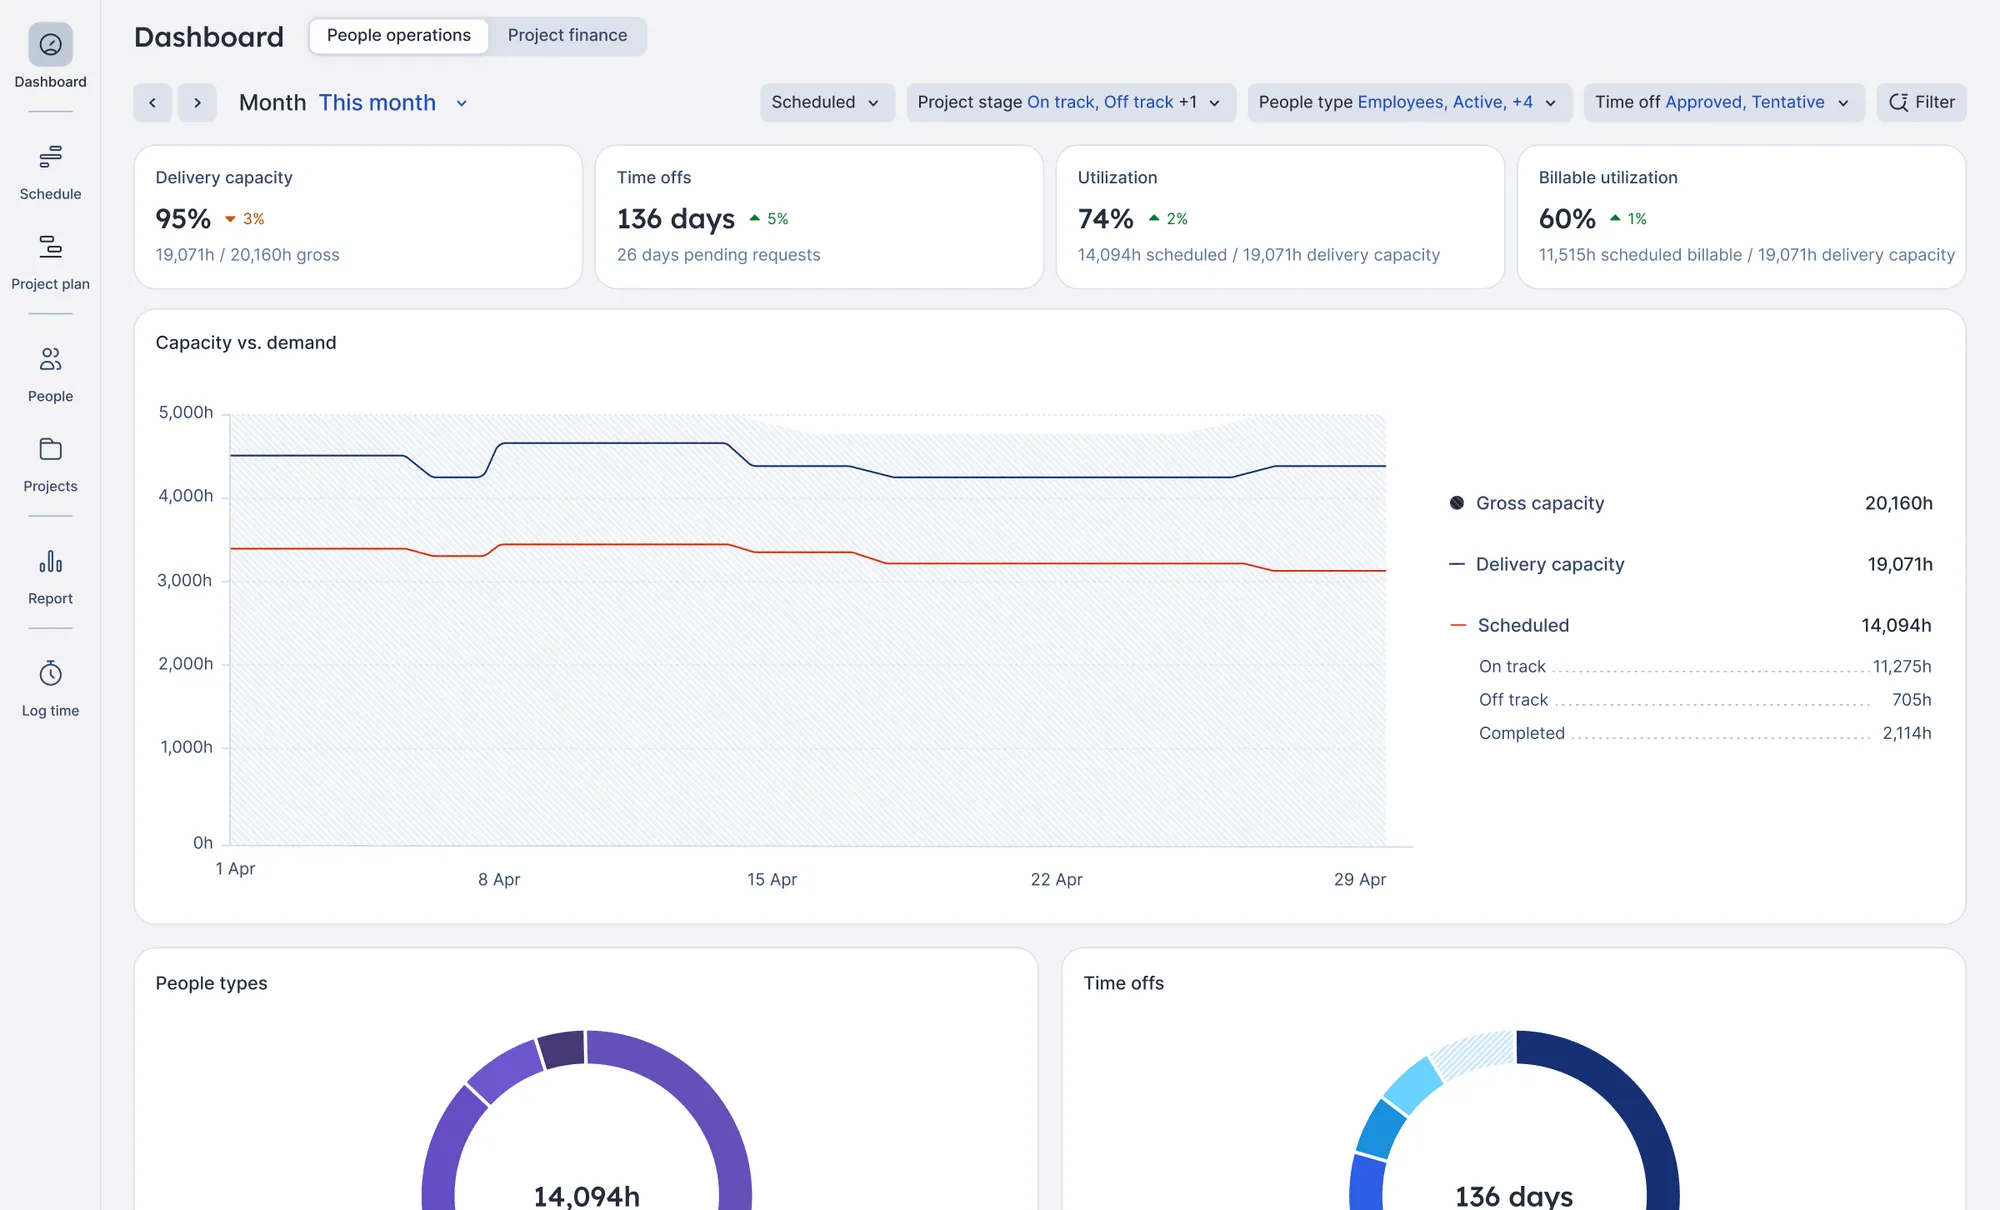
Dashboards: spot delivery risks before they hit your books
Dashboards is where I’d start every time. It’s built around two signals: people operations (do you have the right people in place given your commitments and workload?) and project finance (are there any risks you need to be aware of before they hit your books?).
Dashboards are not meant to replace your finance tool or ERP; they’re meant to guide your delivery decisions. Take a deeper look.
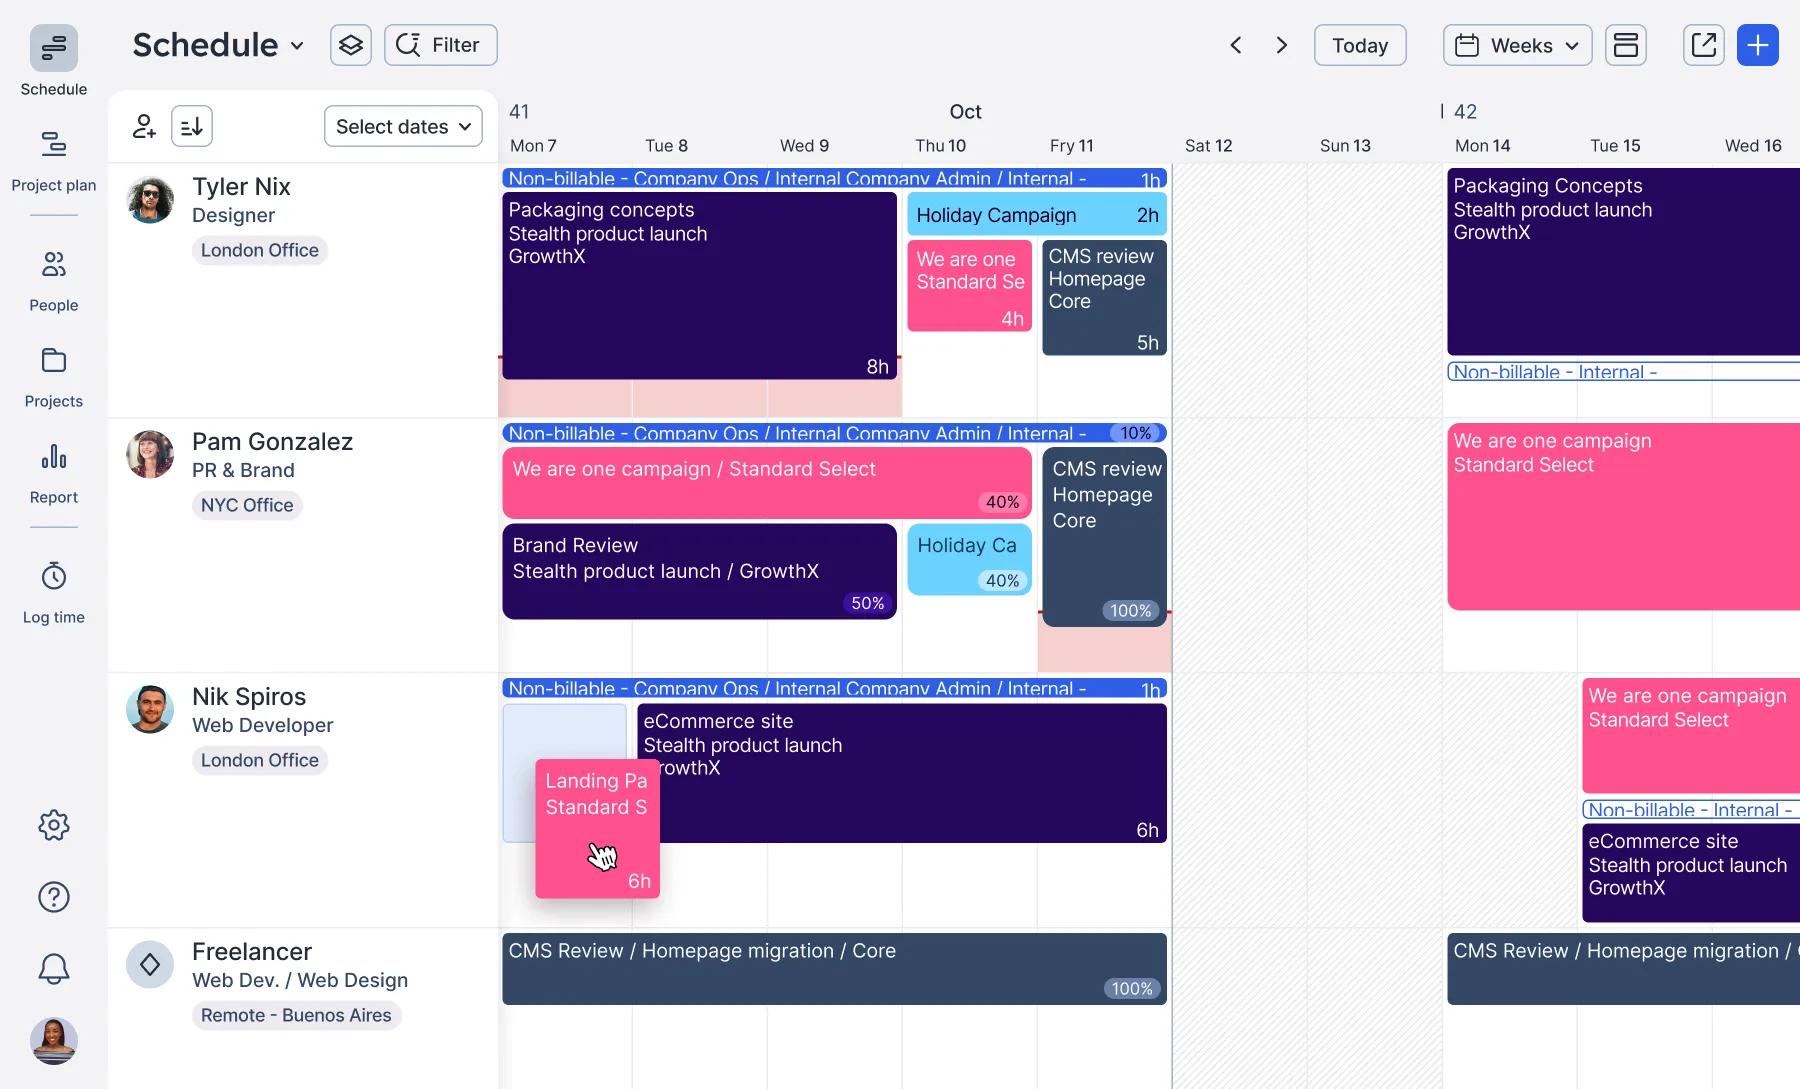
Schedule: quickly find capacity for a new project
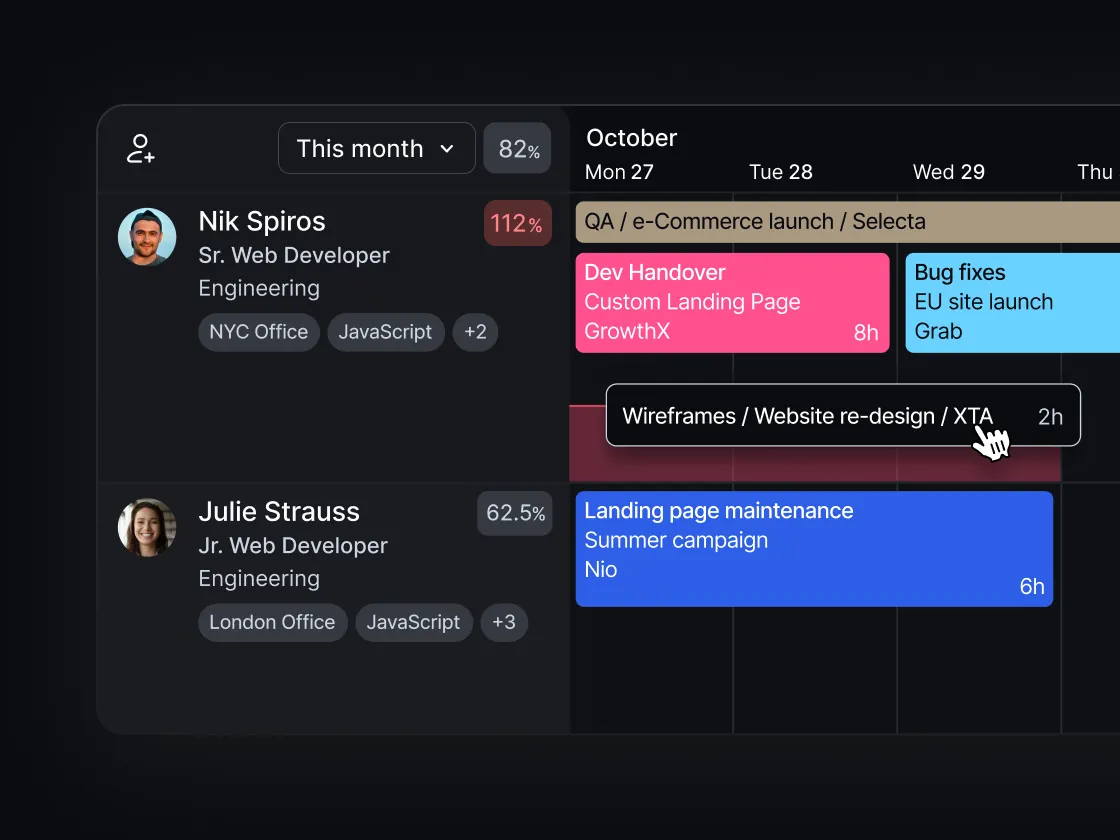
The schedule view gives you a snapshot of where everyone is at a given time. What I find useful is combining the sort and filter options: for example, sort by highest unscheduled time, filter by department or role, and you’ve got a focused view of who can take on a new project.
My pro tip: if you’re managing the same group of people regularly, save your filters so you can re-use them over and over. Check it all out here.
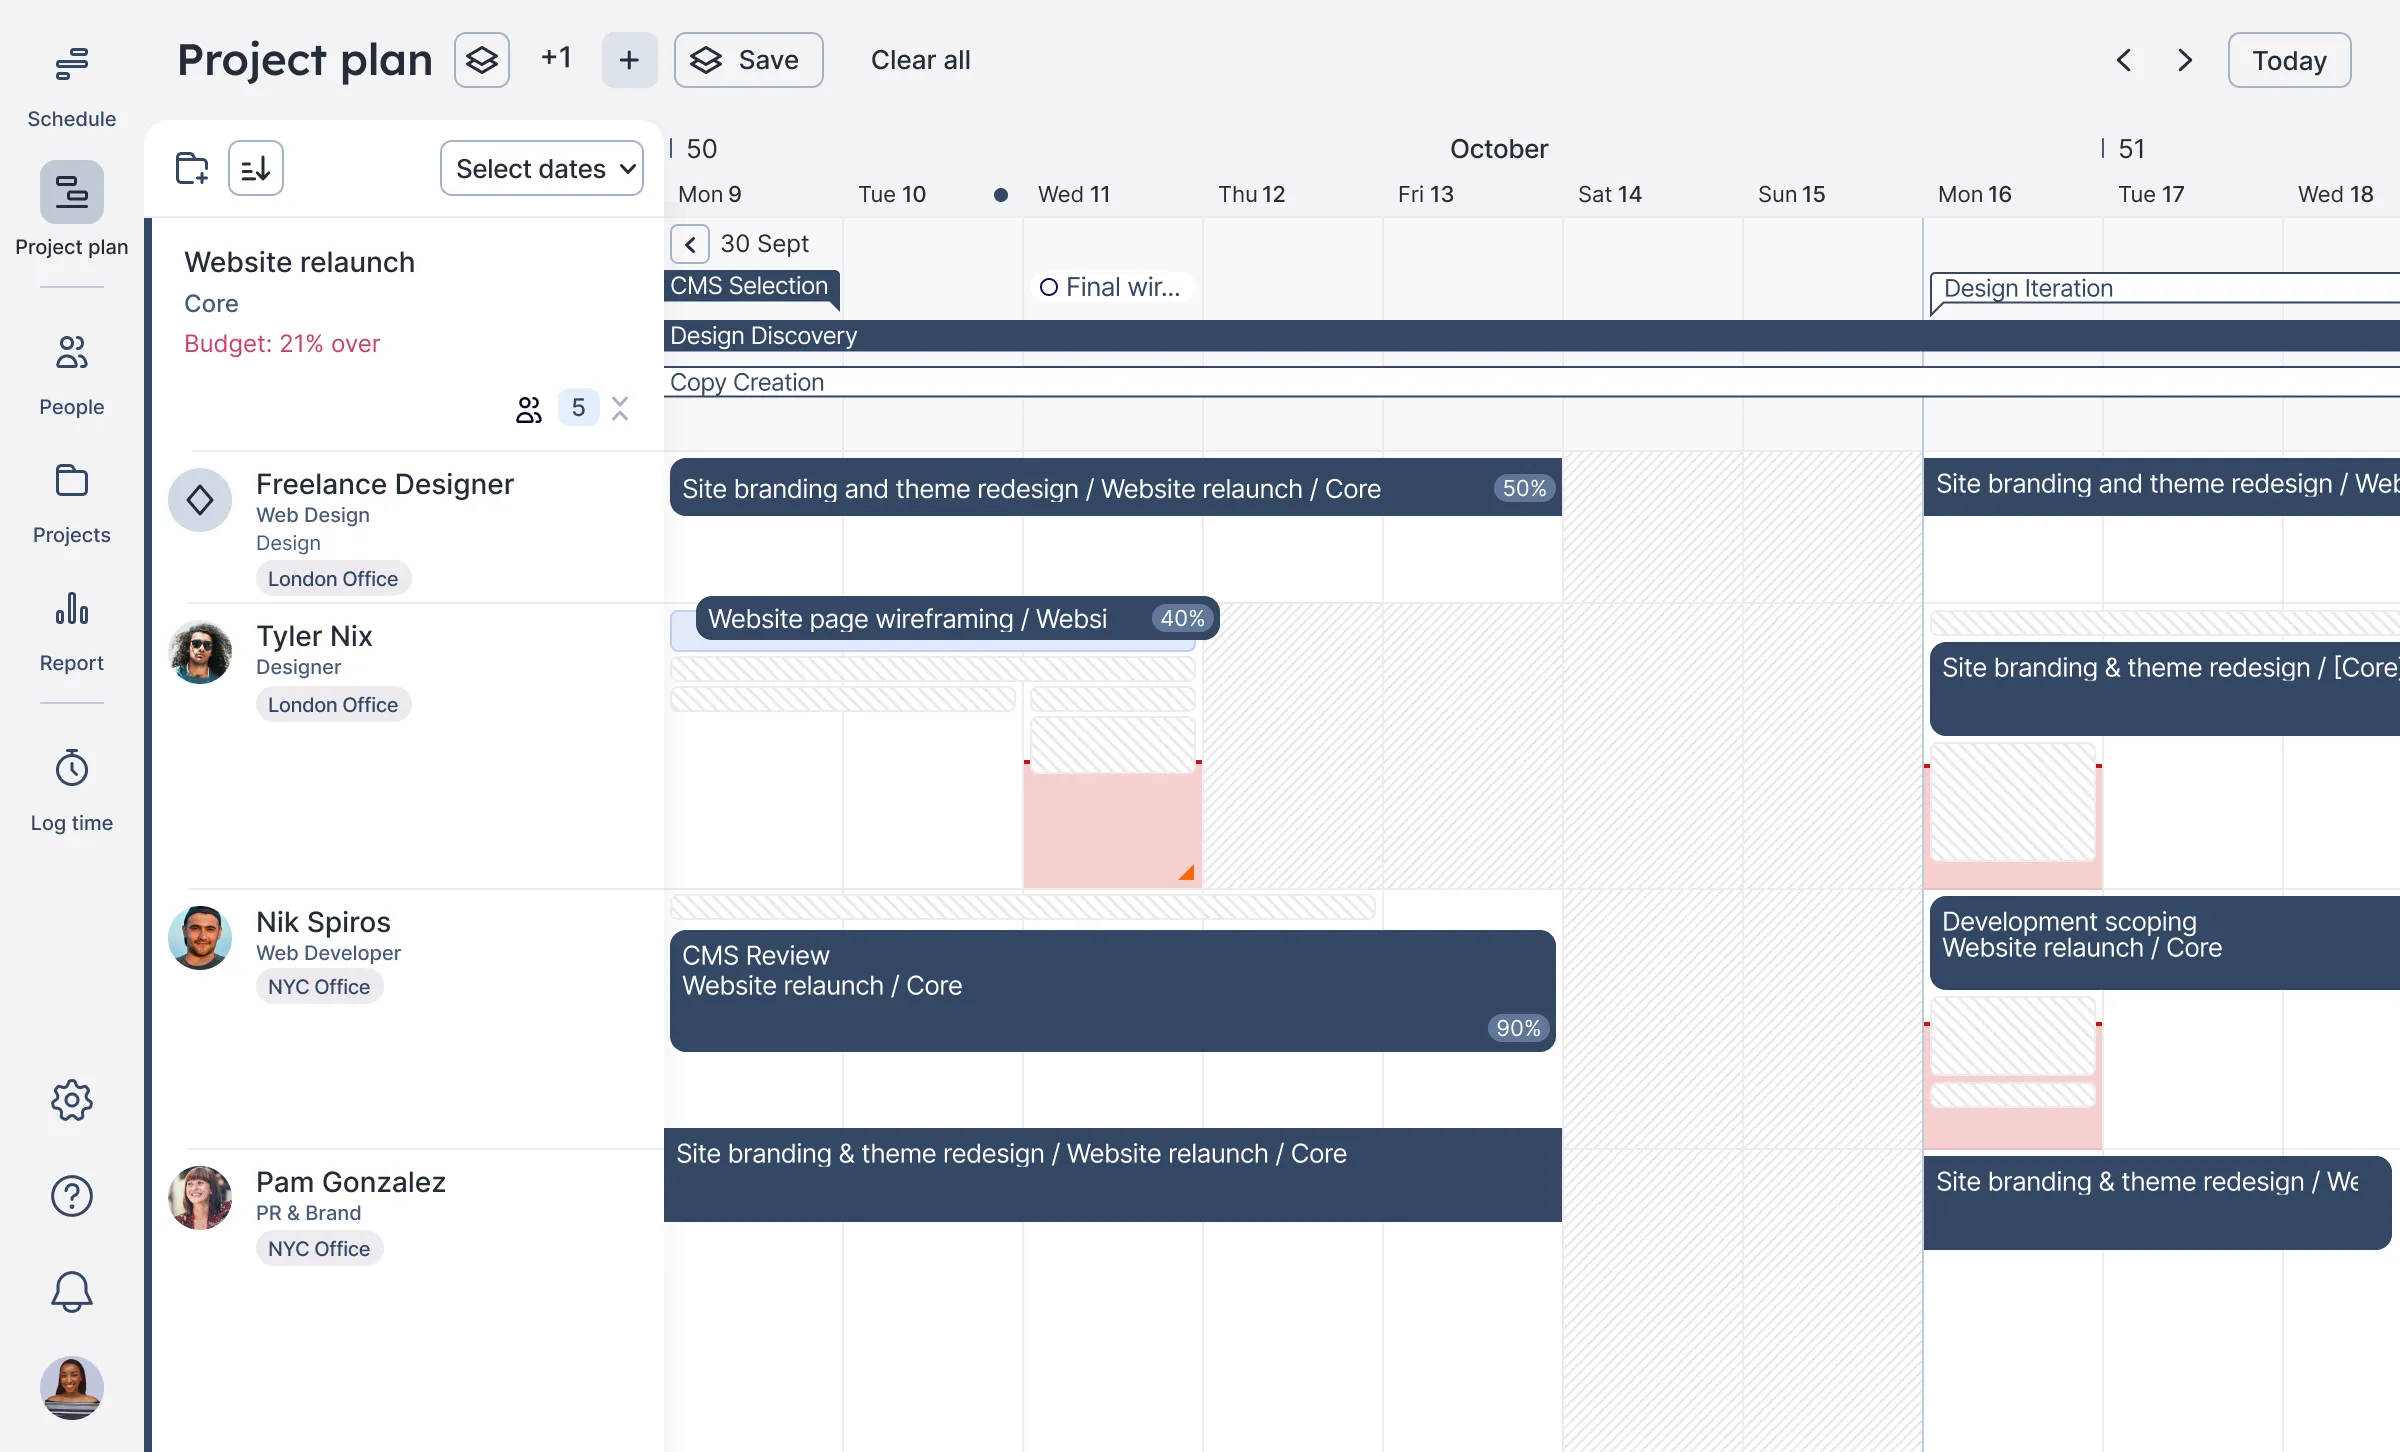
The project plan: keep margin on track as a project runs
The project plan view is where you can monitor margin and budget in real time: as you make changes, you can see how they affect profitability immediately. If you’ve saved an initial estimate, you can compare it against what’s currently scheduled; and if you need to correct anything to stay within budget, you can swap people directly from this view.
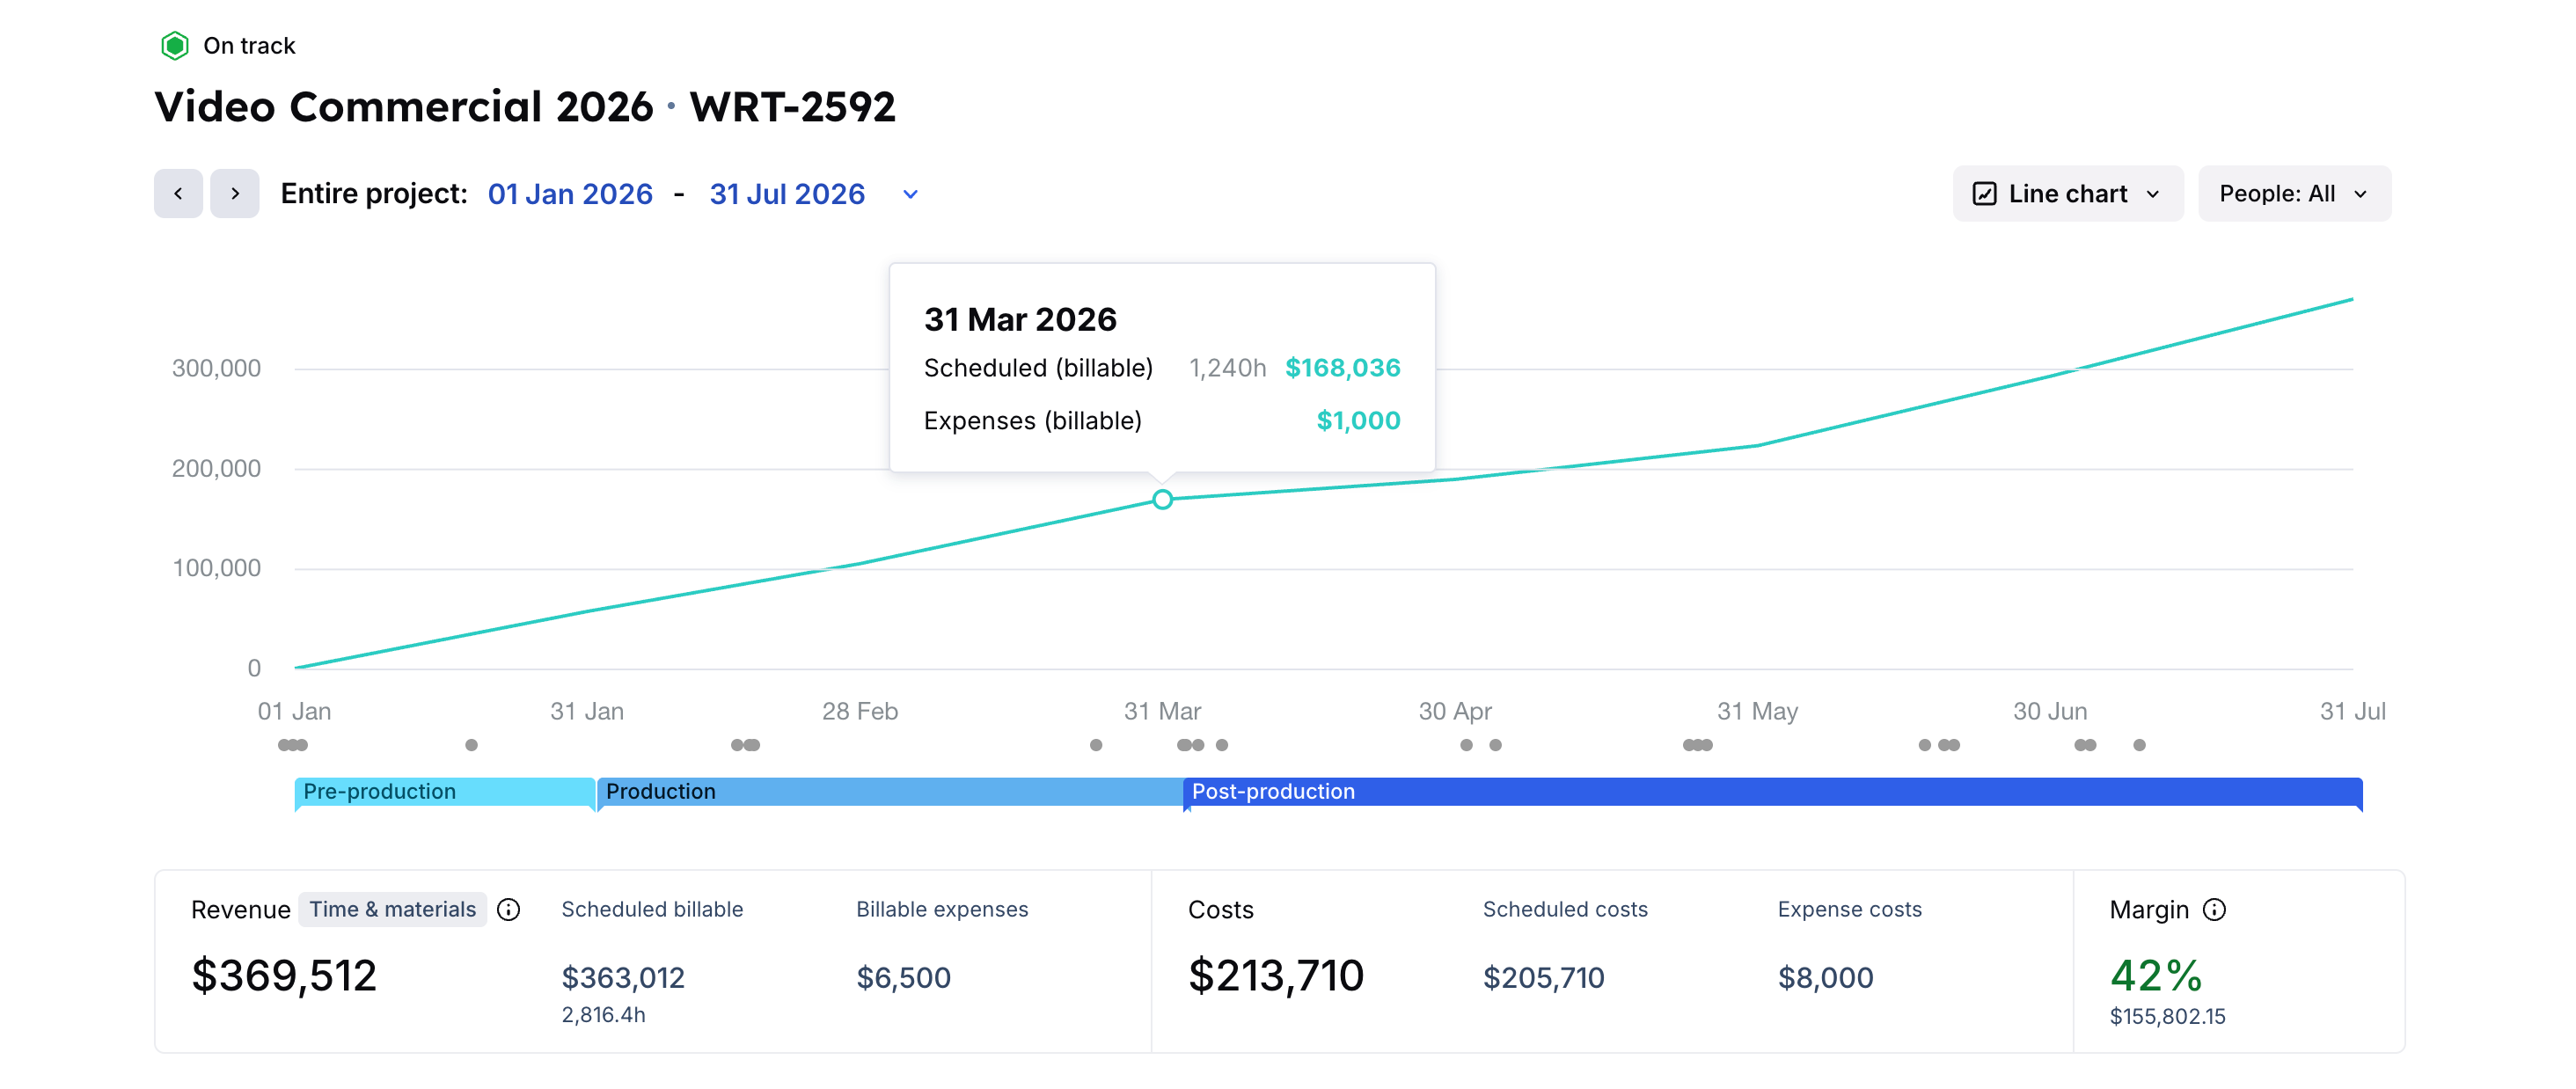
Reports: pull the numbers you need for any delivery conversation
Reports gives you the tabular version: people and projects, side by side. You can sort by any column, click through to a specific person or project, and the filter pre-populates automatically. The chart view inside a project report is a good one — comparing scheduled hours against logged time by month makes it easy to see where delivery is drifting.
🤖 BONUS AI feature: Float MCP
Float MCP is something we recently introduced. You can connect Float to an AI assistant (like Claude or ChatGPT) and ask questions about your data in plain language. Which designers have the most capacity in February? What’s the utilization rate for the creative team? It’s a really useful way to pull a quick summary before a client or planning meeting. We have example prompts in the help center if you want a starting point.
<highlight>If you have any questions, get in touch. We’re here to help! </highlight>
FAQs
Float gives you the full picture of delivery, and makes it easier to understand whether you have the right people in place for your current workload, and whether your projects are tracking to budget before that information reaches your finance team.
Yes: reports can be exported as a CSV, or you can connect via API if you’re feeding the data into another format.