 |
VOOZH | about |
|
VOOZH | about |
B-splines, or basis splines, are an important tool in numerical analysis and computer graphics for curve fitting and data smoothing. They offer a flexible way to represent curves and surfaces through piecewise polynomial functions.
A B-spline is a type of spline function that provides minimal support with respect to a given degree, smoothness, and domain partition. In simpler terms, they are piecewise polynomial functions defined over a sequence of intervals known as knots.
B-splines are defined by their degree n, a set of control points, and a knot vector. The degree of the spline determines the degree of the polynomial pieces that make up the spline. The knot vector is a sequence of parameter values that determine where and how the control points affect the B-spline curve.
The general form of a B-spline can be expressed as:
where
Python's SciPy library provides robust tools for working with B-splines. Here, we explore how to create and manipulate B-splines using SciPy's interpolate module.
To create a B-spline in SciPy, you need to define your knot vector, coefficients, and spline degree. Here's an example:
Output:
This code snippet demonstrates how to define a simple quadratic B-spline using SciPy's BSpline class.
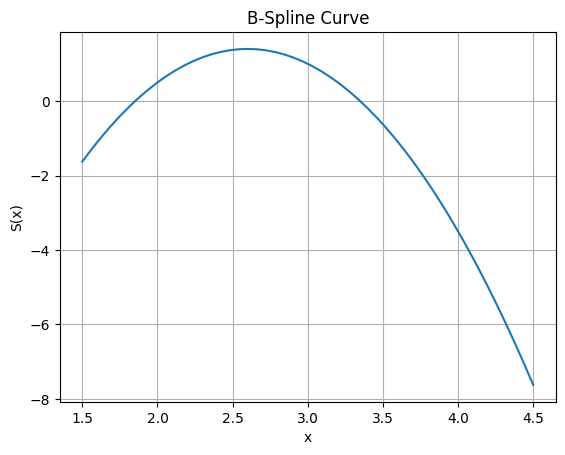
To evaluate a spline at given points or visualize it:
Here's an example using splrep and splev:
Output:
This example shows how to interpolate data using cubic splines.
In some cases, it's beneficial to represent curves parametrically using arc-length parameterization. This approach ensures uniform sampling along the curve's length:
Output:
This example demonstrates how to create parametric splines using equal arc-length intervals.
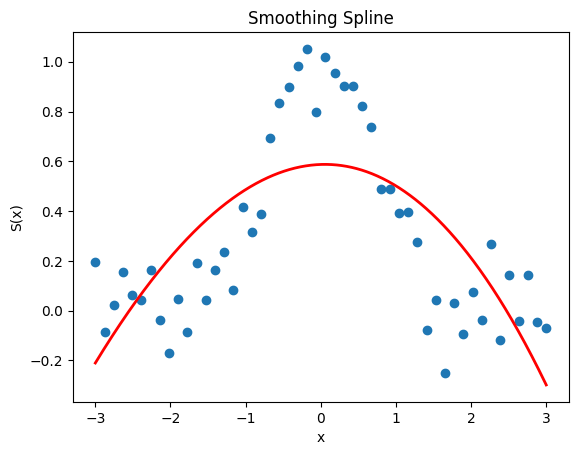
Smoothing splines are used when you want to fit a curve that balances between fitting the data closely and maintaining smoothness:
Output:
This code illustrates how smoothing splines can be used for noise reduction while fitting data smoothly.
B-splines have numerous applications across various domains: