 |
VOOZH | about |
|
VOOZH | about |
Principal Component Analysis is basically a statistical procedure to convert a set of observations of possibly correlated variables into a set of values of linearly uncorrelated variables.
Each of the principal components is chosen in such a way that it would describe most of them still available variance and all these principal components are orthogonal to each other. In all principal components, first principal component has a maximum variance.
These are basically performed on a square symmetric matrix. It can be a pure sums of squares and cross-products matrix Covariance matrix or Correlation matrix. A correlation matrix is used if the individual variance differs much.
PCA basically searches a linear combination of variables so that we can extract maximum variance from the variables. Once this process completes it removes it and searches for another linear combination that gives an explanation about the maximum proportion of remaining variance which basically leads to orthogonal factors. In this method, we analyze total variance.
It is a non-zero vector that stays parallel after matrix multiplication. Let's suppose x is an eigenvector of dimension r of matrix M with dimension r*r if Mx and x are parallel. Then we need to solve Mx=Ax where both x and A are unknown to get eigenvector and eigenvalues.
Under Eigen-Vectors, we can say that Principal components show both common and unique variance of the variable. Basically, it is variance focused approach seeking to reproduce total variance and correlation with all components. The principal components are basically the linear combinations of the original variables weighted by their contribution to explain the variance in a particular orthogonal dimension.
It is basically known as characteristic roots. It basically measures the variance in all variables which is accounted for by that factor. The ratio of eigenvalues is the ratio of explanatory importance of the factors with respect to the variables. If the factor is low then it is contributing less to the explanation of variables. In simple words, it measures the amount of variance in the total given database accounted by the factor. We can calculate the factor's eigenvalue as the sum of its squared factor loading for all the variables.
Now, Let's understand Principal Component Analysis with Python.
To get the dataset used in the implementation, click here.
Import the dataset and distributing the dataset into X and y components for data analysis.
Doing the pre-processing part on training and testing set such as fitting the Standard scale.
Applying the PCA function into the training and testing set for analysis.
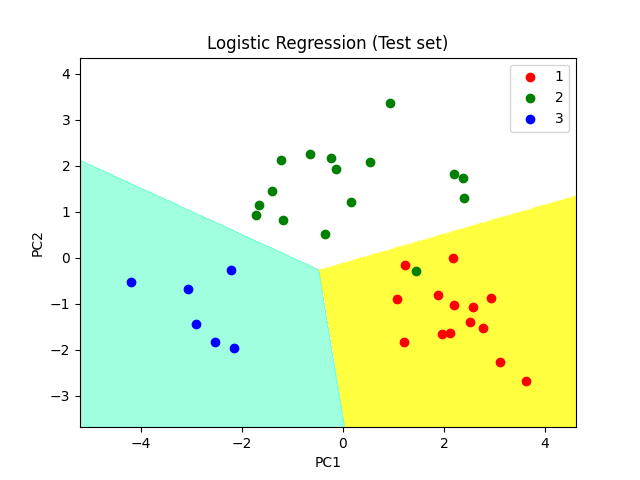
Output:
Output:
Output:
This is a simple example of how to perform PCA using Python. The output of this code will be a scatter plot of the first two principal components and their explained variance ratio. By selecting the appropriate number of principal components, we can reduce the dimensionality of the dataset and improve our understanding of the data.
Notebook link : click here.
Dataset Link: click here