 |
VOOZH | about |
|
VOOZH | about |
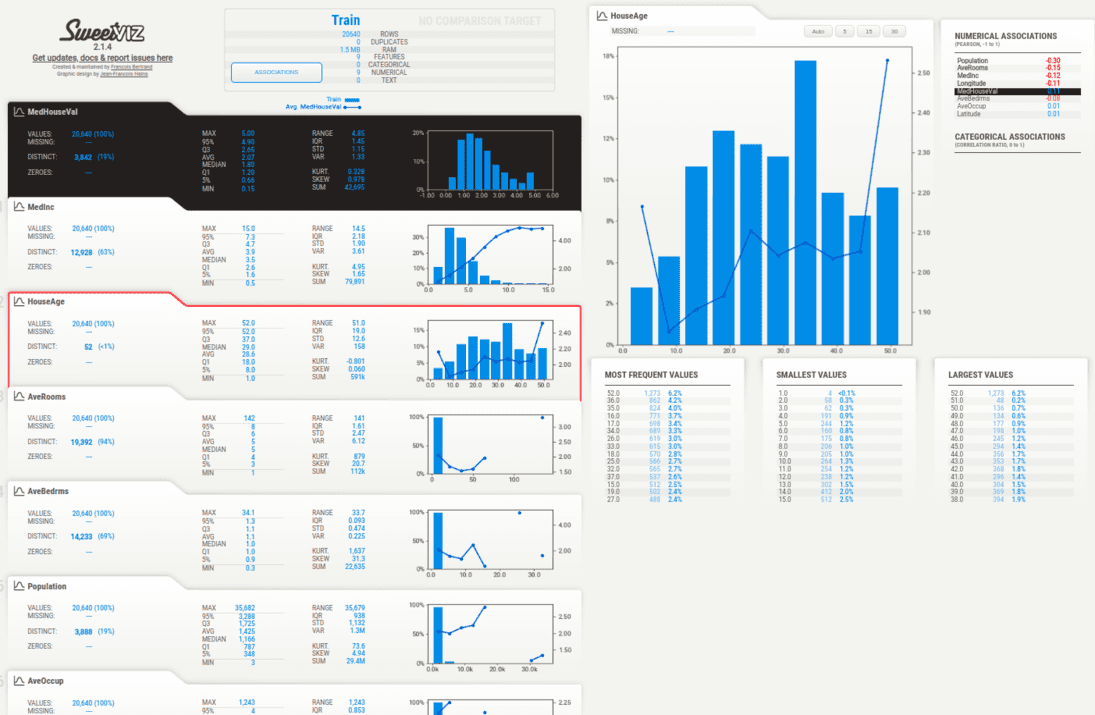
SweetViz is an open-source Python library, this is used for automated exploratory data analysis (EDA), it helps data analysts/scientists quickly generate beautiful & highly detailed visualizations. The output, we get is a fully self-contained HTML application. The system built reports around quickly visualizing the target values & comparing datasets.
Exploratory data analysis (EDA) is the process of analyzing and summarizing the main characteristics of a dataset, often with the goal of understanding the underlying patterns, relationships, and trends in the data.
First, we will install the SweetViz Library by using the pip install command given below:
#installing the library
pip install sweetviz
Output:
<class 'pandas.core.frame.DataFrame'>
RangeIndex: 20640 entries, 0 to 20639
Data columns (total 9 columns):
 # Column Non-Null Count Dtype
--- ------ -------------- -----
 0 MedInc 20640 non-null float64
 1 HouseAge 20640 non-null float64
 2 AveRooms 20640 non-null float64
 3 AveBedrms 20640 non-null float64
 4 Population 20640 non-null float64
 5 AveOccup 20640 non-null float64
 6 Latitude 20640 non-null float64
 7 Longitude 20640 non-null float64
 8 MedHouseVal 20640 non-null float64
dtypes: float64(9)
memory usage: 1.4 MB
for creating the report we have 3 functions:
Once we have created our report object, then simply pass it to one of the two 'show' functions:
show_html() or show_ notebook()
show_html() function will create & save an HTML report (HTML page) at the given file path, &
show_notebook() function will embed the report inside a Notebook.
Output:
Output:
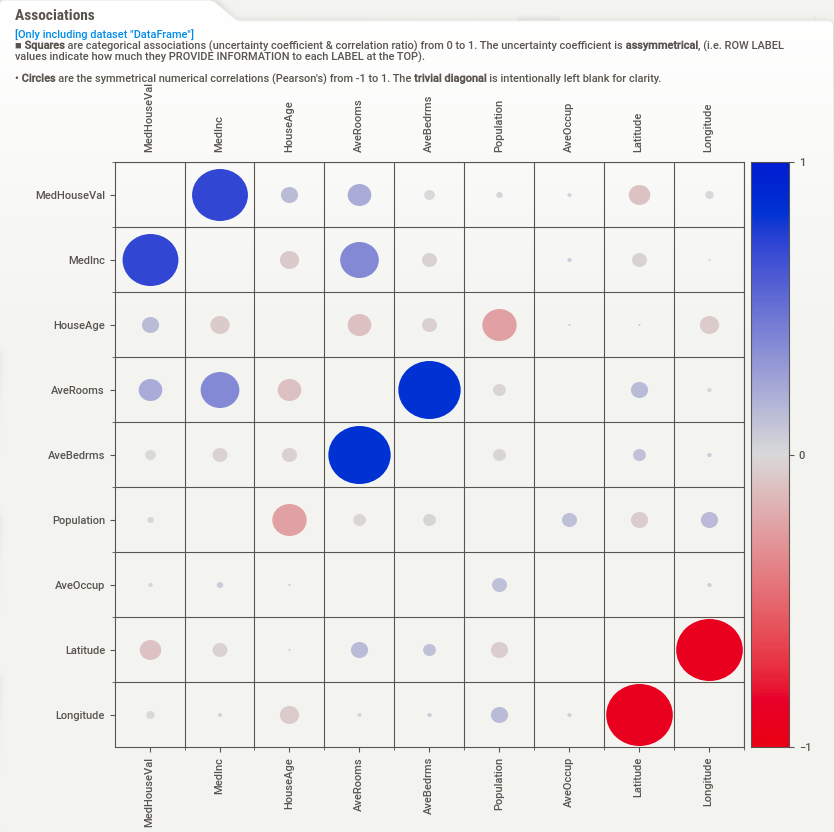
Hovering over the "Associations" button in the navigation bar on the left-hand side of the report will display the Associations graph on the left-hand side of the report. The Associations graph shows the pairwise relationships between all pairs of features in the dataset, with each dot representing a unique combination of two features. The size and color of the dot indicate the strength and direction of the association between the two features, with larger and darker dots indicating stronger positive associations and smaller and lighter dots indicating weaker or negative associations.
Steps
Output:
.png)
.png)