 |
VOOZH | about |
|
VOOZH | about |
Depending on the number of variables under consideration, data analysis can be categorized into three main types: Univariate, Bivariate and Multivariate.
Univariate data involves observations consisting of only one variable. Since there is no relationship or dependency to explore, it is the simplest and most straightforward form of statistical analysis.
Example: Heights (in cm) of seven students in a class:
[164, 167.3, 170, 174.2, 178, 180, 186]
Here the only variable is height and no relationship or interaction with other variables is being considered.
Output:
Bivariate data refers to a dataset where each observation is associated with two different variables. The goal of analyzing bivariate data is to understand the relationship or association between these two variables.
Example: Consider the relationship between temperature and ice cream sales during the summer season:
Temperature | Ice Cream Sales |
|---|---|
20 | 2000 |
25 | 2500 |
30 | 4000 |
35 | 5000 |
In this case, the two variables are temperature and ice cream sales. The data suggests a positive relationship where sales increase as the temperature rises. This shows that as one variable like temperature changes then other variable like ice cream sales also changes in a predictable way.
Output:
Multivariate data contains three or more variables for each observation. The objective is to uncover how multiple variables interact or jointly affect outcomes. It’s crucial in fields like predictive analytics, econometrics and data science, where relationships are seldom limited to two variables.
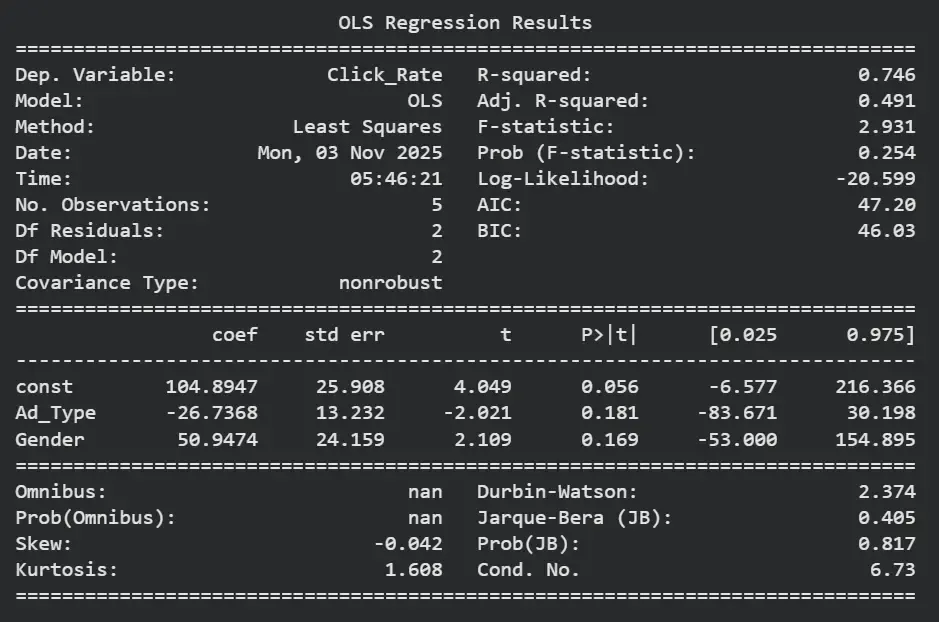
Example: Consider a scenario where an advertiser wants to analyze the click rates for different advertisements on a website. The data includes multiple variables such as advertisement type, gender and click rate.
Advertisement | Gender | Click rate |
|---|---|---|
Ad1 | Male | 80 |
Ad3 | Female | 55 |
Ad2 | Female | 123 |
Ad1 | Male | 66 |
Ad3 | Male | 35 |
Here there are three variables: advertisement type, gender and click rate. Multivariate analysis allows us to see how these variables interact and how one variable might affect another in the context of the others.
Output:
Lets see a tabular difference between each of them for better understanding.
| Feature | Univariate | Bivariate | Multivariate |
|---|---|---|---|
| Variables | One | Two | More than two |
| Objective | Describe a single variable | Examine relationship between two variables | Understand relationships among multiple variables |
| Dependency | No dependent variable | One dependent variable | Multiple dependent variables |
| Techniques | Descriptive statistics, histogram | Correlation, scatter plot, regression | Regression, PCA, MANOVA |
| Visualization | Histogram, Box Plot | Scatter Plot, Regression Line | Pair Plot, Heatmap, 3D Analysis |
| Example | Height of students | Temperature vs Ice Cream Sales | Ad Type, Gender & Click Rate |
| Complexity | Low | Moderate | High |