Canonical Correlation Analysis (CCA) is a statistical method for examining relationships between two sets of multivariate variables measured on the same subjects. It identifies and quantifies associations by computing canonical variates which are orthogonal linear combinations of variables that maximize the correlation between two sets of variables.
Analyzes relationships between two sets of variables often denoted as X and Y
Computes canonical variables (variates) as linear combinations of original variables
Maximizes correlation between the two sets of canonical variables
Used in psychology, sociology, biology and economics to uncover association patterns
How it Works
Canonical Correlation Analysis (CCA) finds relationships between two multivariate datasets by constructing pairs of linear combinations one from each dataset that are maximally correlated.
Step 1: Define Two Variable Sets
CCA works on two multivariate datasets measured on the same observations.
Step 2: Form Linear Combinations
CCA creates one linear combination from each dataset.
where
a: weight vector for X
b: weight vector for Y
Step 3: Maximize Correlation
The weights are chosen to maximize the correlation between U and V
Step 4: Solve Eigenvalue Problem
Applying normalization constraints leads to:
Step 5: Obtain Canonical Correlation
The canonical correlation is:
Step By Step Implementation of CCA in Python
Step 1: Import Required Libraries
Load all necessary Python libraries for data handling, visualization, preprocessing and CCA.
Step 2: Load the Dataset
Fetch the California Housing dataset and convert it into a DataFrame.
Step 3: Create Synthetic Views
Dataset is single-view, split the features into two groups to simulate two different views.
Step 4: Standardize Each View
Scale both views independently so that features have zero mean and unit variance.
Step 5: Select a Sample for CCA
Use a subset of the data to reduce computation time.
Step 6: Apply Canonical Correlation Analysis
Fit the CCA model and transform both views into their canonical representations.
Step 7: Compute Canonical Correlation
Calculate the correlation between the first pair of canonical variables.
Output:
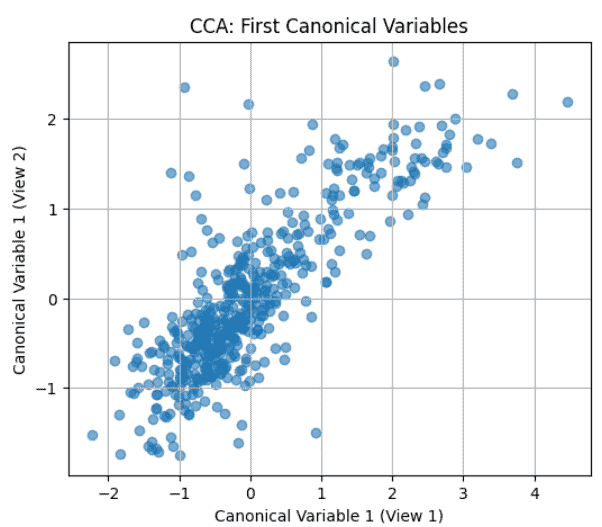
First canonical correlation: 0.82
Step 8: Visualize the Canonical Variables
Plot the first canonical variables from both views to observe their relationship.
This plot shows the first pair of canonical variables from the two views, with each point representing one observation. The strong linear clustering along a diagonal indicates a high canonical correlation, meaning CCA has successfully captured a strong shared relationship between the two datasets.
Interpreting CCA Results
Canonical correlations measure the strength of association between the two variable sets higher values indicate stronger relationships.
Canonical variates represent the optimal linear combinations that capture shared patterns between the sets, similar to factors in factor analysis.
Variable loadings show how strongly each original variable contributes to a canonical variate, interpreted like factor loadings.
Application
Psychology: Examines relationships between sets of psychological variables such as personality traits and job or academic performance.
Economics: Analyzes interdependencies between economic indicators and social factors (education, healthcare).
Medicine: Studies associations between multiple biological factors (genes, biomarkers) and disease or treatment outcomes.
Neuroscience: Identifies relationships between brain activity patterns and cognitive or behavioral processes.
Marketing and CRM: Reveals links between customer demographics and purchasing behavior to improve targeted marketing strategies.
Advantages
Identifying Relationships: Reveal underlying relationships between two sets of variables, even when the variables within each set are highly correlated.
Dimensionality Reduction: CCA can reduce the dimensionality of the data by identifying the most important linear combinations of variables in each set.
Interpretability: The results of CCA are often easy to interpret, as the canonical variables represent the most correlated pairs of variables between the two sets.
Multivariate Analysis: CCA allows for the analysis of multiple variables simultaneously, making it suitable for studying complex relationships.
Limitations
Linear Relationships: CCA assumes that the relationships between variables are linear, which may not always be the case in real-world data.
Sensitivity to Outliers: CCA can be sensitive to outliers, which can affect the estimation of the canonical correlations and vectors.
Interpretation of Canonical Variables: While the canonical variables are easy to interpret, interpreting the original variables in terms of these canonical variables can be challenging.
Large Sample Size Requirement: CCA may require a relatively large sample size which is not possible every time.
