 |
VOOZH | about |
|
VOOZH | about |
sar (System Activity Report) It can be used to monitor Linux system's resources like CPU usage, Memory utilization, I/O devices consumption, Network monitoring, Disk usage, process and thread allocation, battery performance, Plug and play devices, Processor performance, file system and more. Linux system Monitoring and analyzing aids in understanding system resource usage which can help to improve system performance to handle more requests.
By default, the SAR command displays the result on the output screen, in addition, result can also be stored in the file specified by the -o filename option.
Any user can collect information about system performance using system activity flags. The SAR command will show only CPU monitoring activity if any flag is not specified by the user.
Linux offers different system monitoring commands including top, htop, vmstat, iostat, and free, but SAR (System Activity Report) possesses certain merits that have resulted in it becoming an option for monitoring performance as well as to troubleshoot.
`sar` may not be installed by default. We need to install `sysstat` before using it
sudo apt install sysstatsudo dnf install sysstatsar -[ options ] time_interval number_of_tines_to_display
SAR saves system activity logs that can be analyzed later using different options.
This command displays all system activity reports, including CPU, memory, I/O, and network statistics.
sar -AThis retrieves yesterday's recorded system data, useful for troubleshooting past performance issues.
sar -f /var/log/sysstat/sa$(date --date='yesterday' +%d)This command fetches CPU stats recorded on the 10th day of the month.
sar -u -f /var/log/sysstat/sa10This helps track network bandwidth and detect unusual traffic spikes.
sar -n DEV 2 5This stores SAR logs in a file, which can be imported into Excel, Grafana, or custom scripts for better visualization.
sar -A -o output_fileSyntax:
systemctl start sysstat.serviceSyntax:
sar --helpWe need to enter the root password for authentication.
Syntax:
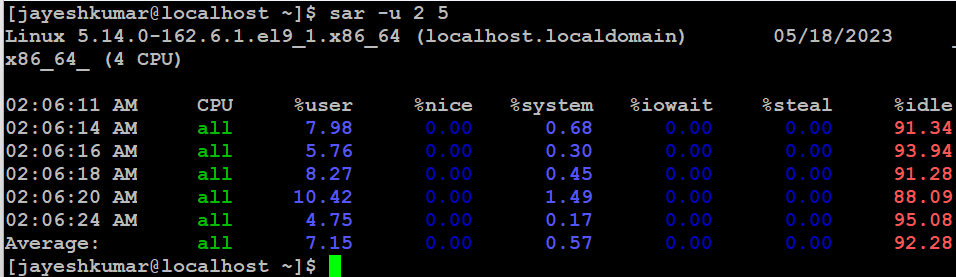
sar -VTo report CPU details a total of 5 times with the interval of 2 seconds. If the interval command is set to zero, average statistics from the time system started are presented. If the count is not provided and the interval is given, statistics are provided continuously after every interval.
Syntax:
sar -u 2 5To report about the amount of memory used, amount of memory free, available cache, available buffers total 3 times with the interval of 1 second.
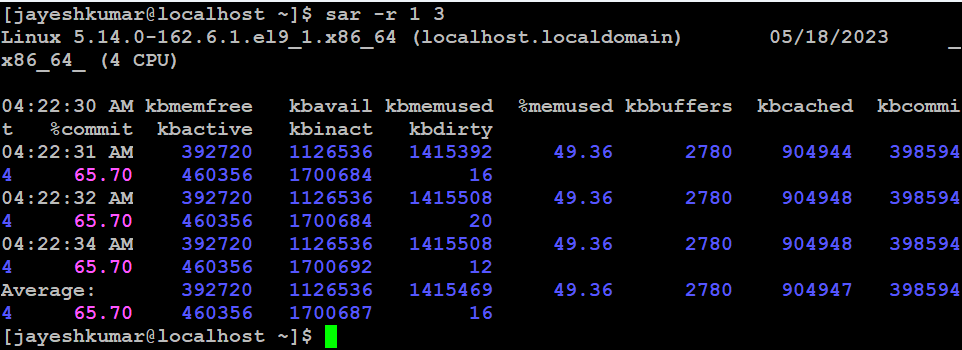
Syntax:
sar -r 1 3To report about file systems mounted on the device total 5 times with the interval of 2 seconds.
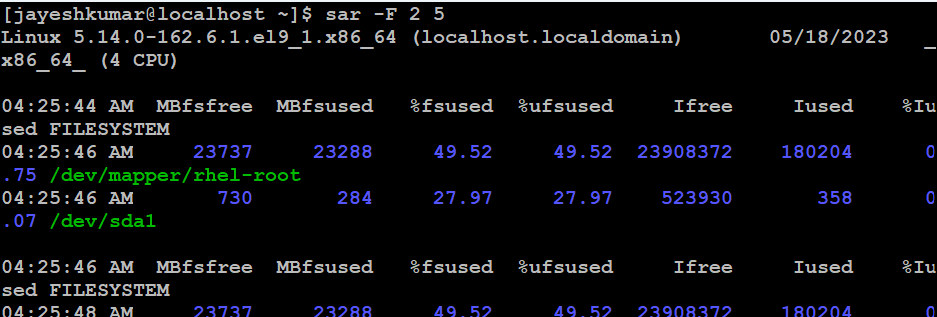
Syntax:
sar -F 2 5To report about block devices details total 3 times with the interval of 1 second.
Syntax:
sar -d 1 3To report run queue length, number of processes and load average
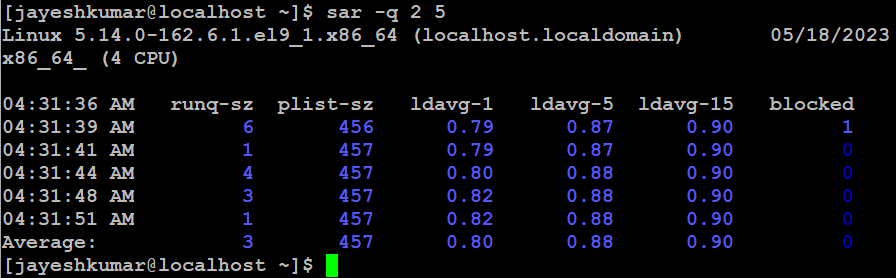
Syntax:
sar -q 2 5To report cpu usage for given core
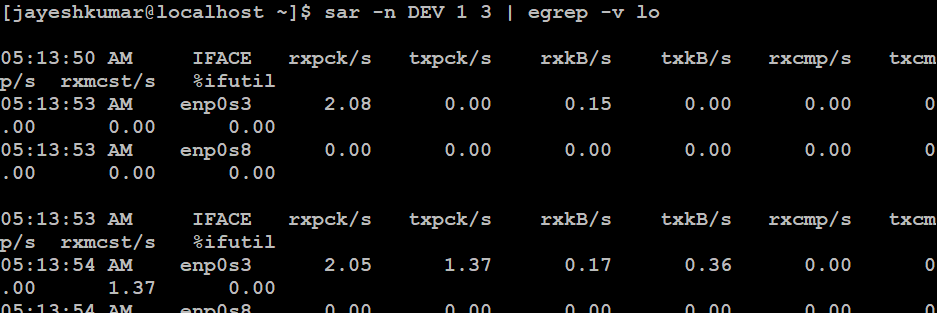
sar -P 1 1 3To report about network interface, network speed, IPV4, TCPV4, ICMPV4 network traffic and errors
Syntax:
sar -n DEV 1 3 | egrep -v loTo report details about the process, kernel thread, i-node, and the file tables
Syntax:
sar -v 1 3Instead of running SAR manually, you can schedule it to log system performance automatically
Enable the SAR Data Collector on Startup
sudo systemctl enable sysstatVerify Data Collection is Enabled
cat /etc/default/sysstat # Make sure ENABLED="true" is set.
Than restart the service
sudo systemctl restart sysstatModify the Data Collection Interval
sudo nano /etc/cron.d/sysstatUpdate the recording frequency from every 10 minutes (default) to every 5 minutes
*/5 * * * * root /usr/lib/sysstat/sa1 1 1Schedule a Daily SAR Summary Report
@daily root /usr/lib/sysstat/sar -A > /var/log/sysstat/summary_report_$(date +\%F).logTo report messages, semaphores and processes details for all processors and system-wide.
sar -mu -P ALLNote: The above command might not work on older systems or older
sysstatversions. The correct approach is to split the commands or use compatible flags. Like Some users may be using Ubuntu 20.04 or earlier, which comes with older versions ofsysstat. This might cause incompatibilities with certain flags.
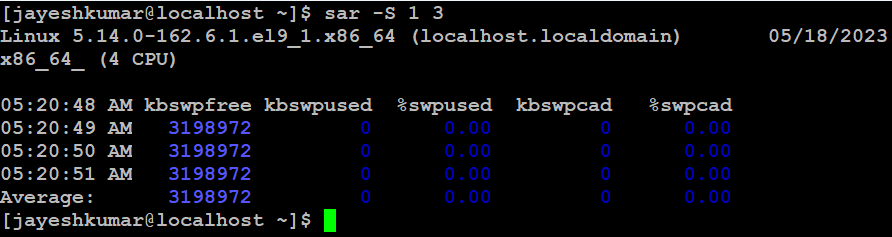
To report statistics about swapping
Syntax:
sar -S 1 3To report details about I/O operations like transaction per second, read per second, write per second.
syntax:
sar -b 1 3To report statistics about context switching, number of processes created per second, number of swap per second .
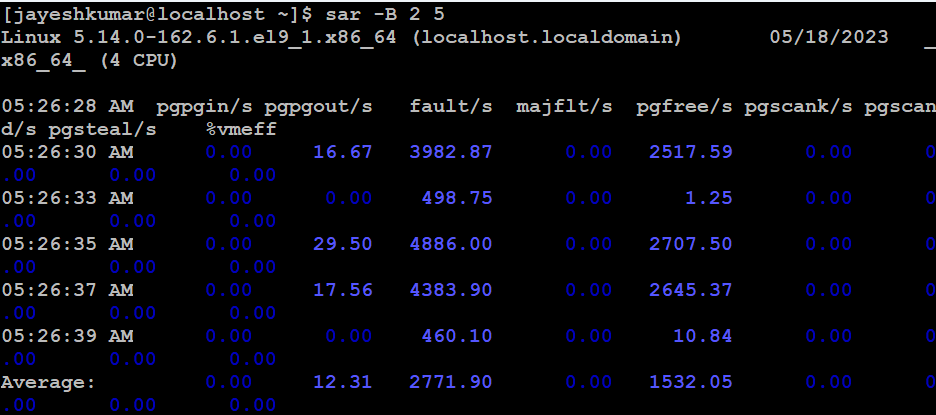
sar -w 1 3To report paging statistics (KBs paged-in/sec, KBs paged-out/sec, pagefault/sec etc.)
sar -B 2 5If your server slows down regularly, you can use below command which identifies CPU spikes and shows if background processes or high application loads are at fault.
sar -u 1 5If your online store crashes during sales time, execute the following command to monitor memory usage in real-time, which can help detect memory leaks or memory-hungry processes.
sar -r 5 10If your database query is taking longer than normal, inspect disk activity
sar -d 2 5If your server is slow, but CPU and memory are okay, inspect network usage
sar -n DEV 1 5In this article we discussed The SAR (System Activity Report) command in Linux is a powerful tool for monitoring and analyzing system resources. It provides detailed information on CPU usage, memory utilization, I/O devices, network monitoring, disk usage, and more. SAR helps system administrators and developers understand system performance, identify bottlenecks, and optimize resource allocation for improved efficiency and stability. It is an essential tool for managing and optimizing Linux systems.