
InfluxDB for Network & Infrastructure Monitoring
Prevent downtime before it starts
Modern networks demand more than stitched-together logs and dashboards. InfluxDB ingests high‑resolution telemetry from every router, switch, and firewall without collapsing under the load. Get instant visibility into real-time conditions and the historical context to understand them.
Built for modern network operations
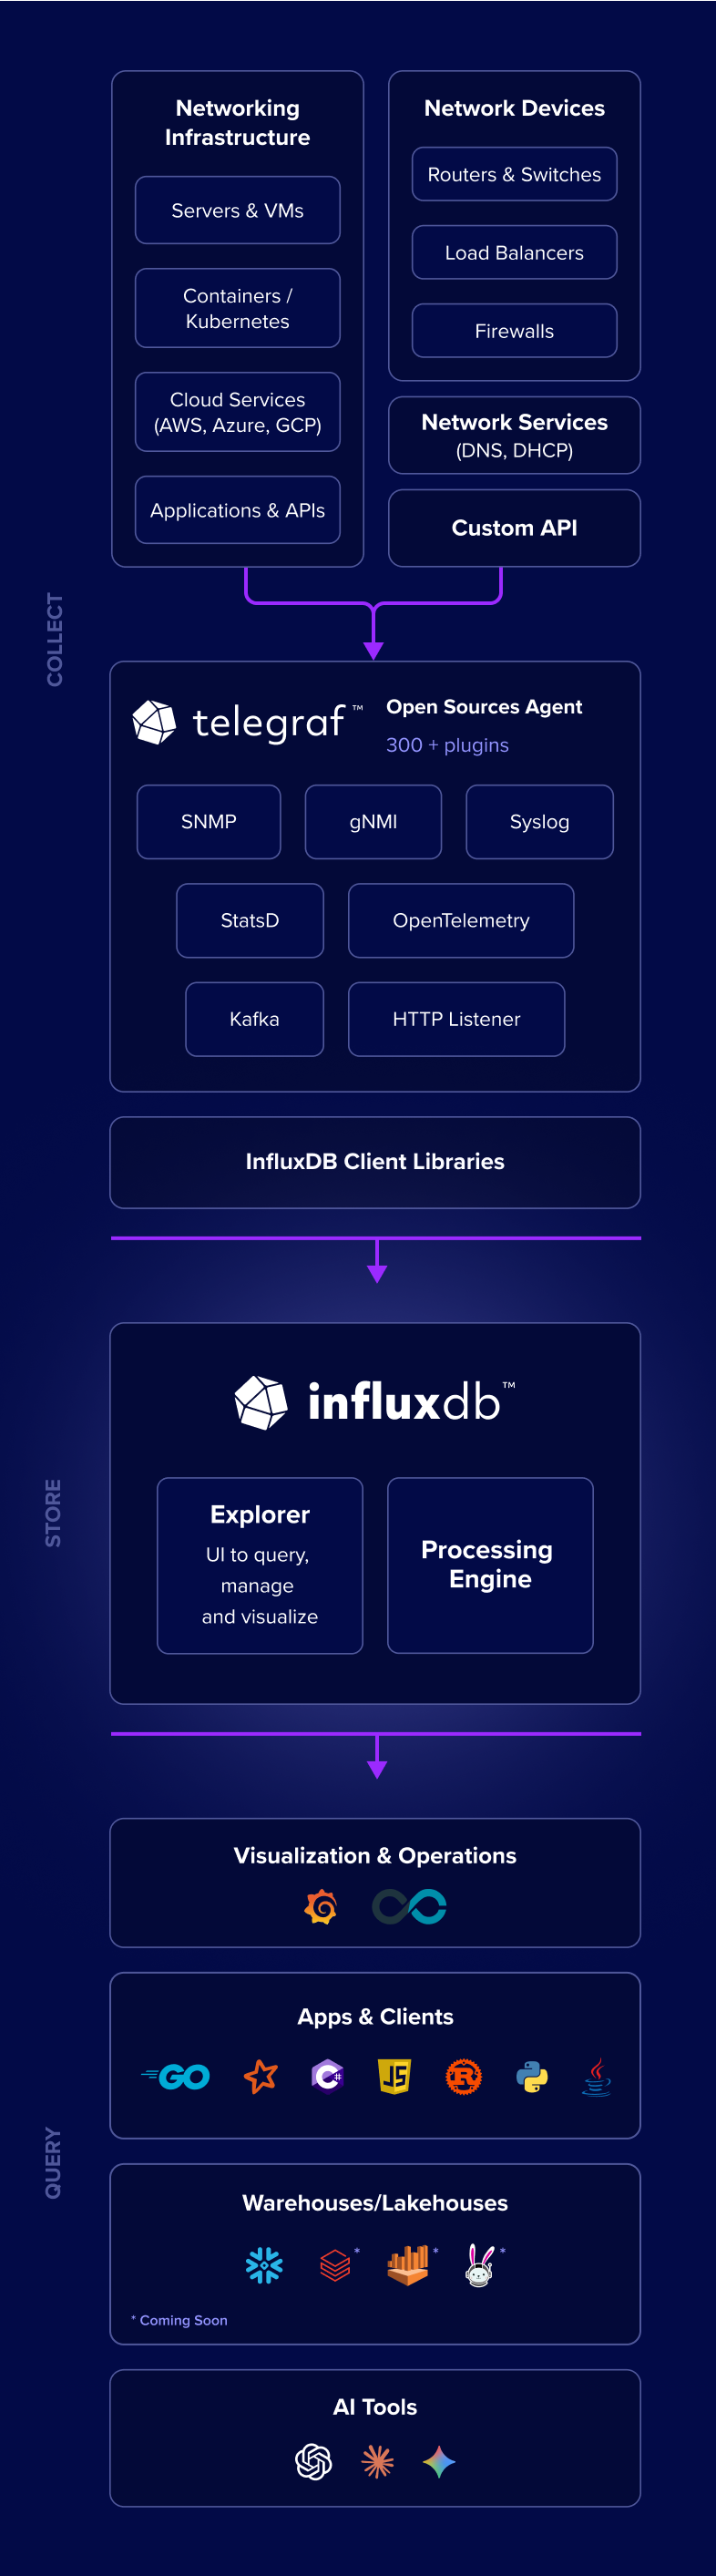
Collect millions of metrics per second at sub-second granularity from servers, switches, routers, cloud services, and applications.
Run milliseconds-fast queries on live or historical data. Perform the complex temporal analysis that network data demands, from pinpointing anomalies to correlating events across long time ranges.
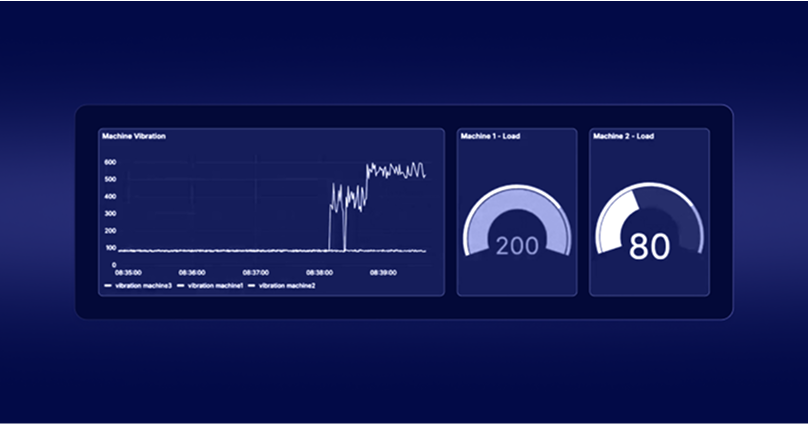
Break down data silos. Consolidate telemetry and metrics from disparate systems to power live dashboards, anomaly detection, and automated alerts.
Scale economically, using efficient compression and storage to keep costs in check.
Ingest metrics via native connectors for SNMP, gNMI, Kafka, MQTT, and 300+ Telegraf plugins.
Proactive operations for always-on infrastructure
InfluxDB unifies real-time and historical network telemetry so operations teams can move from simple monitoring to proactive improvement. Detect anomalies early, automate responses, and keep critical infrastructure performing at scale.
Unified Monitoring for APIs and Integrations
MuleSoft built its Anypoint Platform™ on InfluxDB to deliver real-time monitoring and diagnostics across every API and integration. With InfluxDB as its core data infrastructure, MuleSoft provides customers with actionable visibility to identify and resolve issues quickly, turning time series into measurable business impact.
Read case study
High-Volume Network Monitoring, Simplified
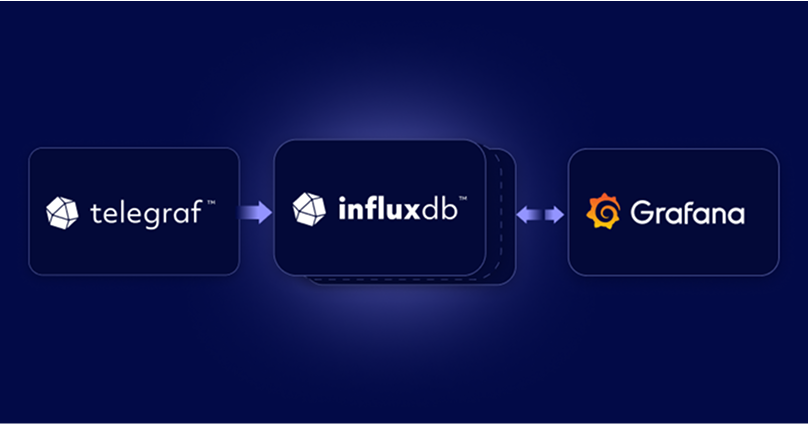
WideOpenWest (WOW!) uses InfluxDB to monitor 650,000 cable modems every five minutes, streaming SNMP telemetry through Kafka into a four-node cluster. Real-time analytics and Grafana dashboards let engineers spot signal issues and service degradations before customers are affected—while replacing multiple legacy monitoring tools with one unified platform.
Read case study
Proactive SRE Monitoring
at Cloud Scale
NetApp’s SRE team uses InfluxDB to track real-time resource trends, perform SLO/SLI calculations, and trigger instant alerts across a globally distributed infrastructure. High-ingest performance and seamless Grafana and Slack integrations give engineers in the U.S. and India a shared, real-time view of critical Linux servers and databases, enabling rapid detection of resource spikes and faster incident response.
Read case study
Unified Monitoring for Global Network Operations
Cisco uses InfluxDB as the core of its custom DevOps monitoring stack to track uptime, load, and availability for its global service renewals platform. By integrating InfluxDB and Telegraf with Cisco NX-OS, the company provides network operators with a single pane of glass to monitor network, compute, and storage infrastructure in real-time.
Read case study
Five Nines of Reliability for Cloud Communications
Vonage uses InfluxDB to monitor millisecond-resolution metrics across its global ContactWorld platform, ensuring 99.999% availability even during tens of thousands of simultaneous calls. Real-time visibility into service metrics lets the team detect issues instantly and maintain seamless cloud communications for customers worldwide.
Read case studyMuleSoft built its Anypoint Platform™ on InfluxDB to deliver real-time monitoring and diagnostics across every API and integration. With InfluxDB as its core data infrastructure, MuleSoft provides customers with actionable visibility to identify and resolve issues quickly, turning time series into measurable business impact.
Read case study 👁 Slide 1WideOpenWest (WOW!) uses InfluxDB to monitor 650,000 cable modems every five minutes, streaming SNMP telemetry through Kafka into a four-node cluster. Real-time analytics and Grafana dashboards let engineers spot signal issues and service degradations before customers are affected—while replacing multiple legacy monitoring tools with one unified platform.
Read case study 👁 Slide 2NetApp’s SRE team uses InfluxDB to track real-time resource trends, perform SLO/SLI calculations, and trigger instant alerts across a globally distributed infrastructure. High-ingest performance and seamless Grafana and Slack integrations give engineers in the U.S. and India a shared, real-time view of critical Linux servers and databases, enabling rapid detection of resource spikes and faster incident response.
Read case study 👁 Slide 3Cisco uses InfluxDB as the core of its custom DevOps monitoring stack to track uptime, load, and availability for its global service renewals platform. By integrating InfluxDB and Telegraf with Cisco NX-OS, the company provides network operators with a single pane of glass to monitor network, compute, and storage infrastructure in real-time.
Read case study 👁 Slide 4Vonage uses InfluxDB to monitor millisecond-resolution metrics across its global ContactWorld platform, ensuring 99.999% availability even during tens of thousands of simultaneous calls. Real-time visibility into service metrics lets the team detect issues instantly and maintain seamless cloud communications for customers worldwide.
Read case study 👁 Slide 4One platform for unified network visibility
InfluxDB helps you unify your entire network stack by collecting telemetry through hundreds of Telegraf plugins and open protocols. From modern gNMI to legacy SNMP, it provides a single, vendor-neutral view of all your infrastructure, ending the days of stitching data together from dozens of tools.
👁 Open-connectivity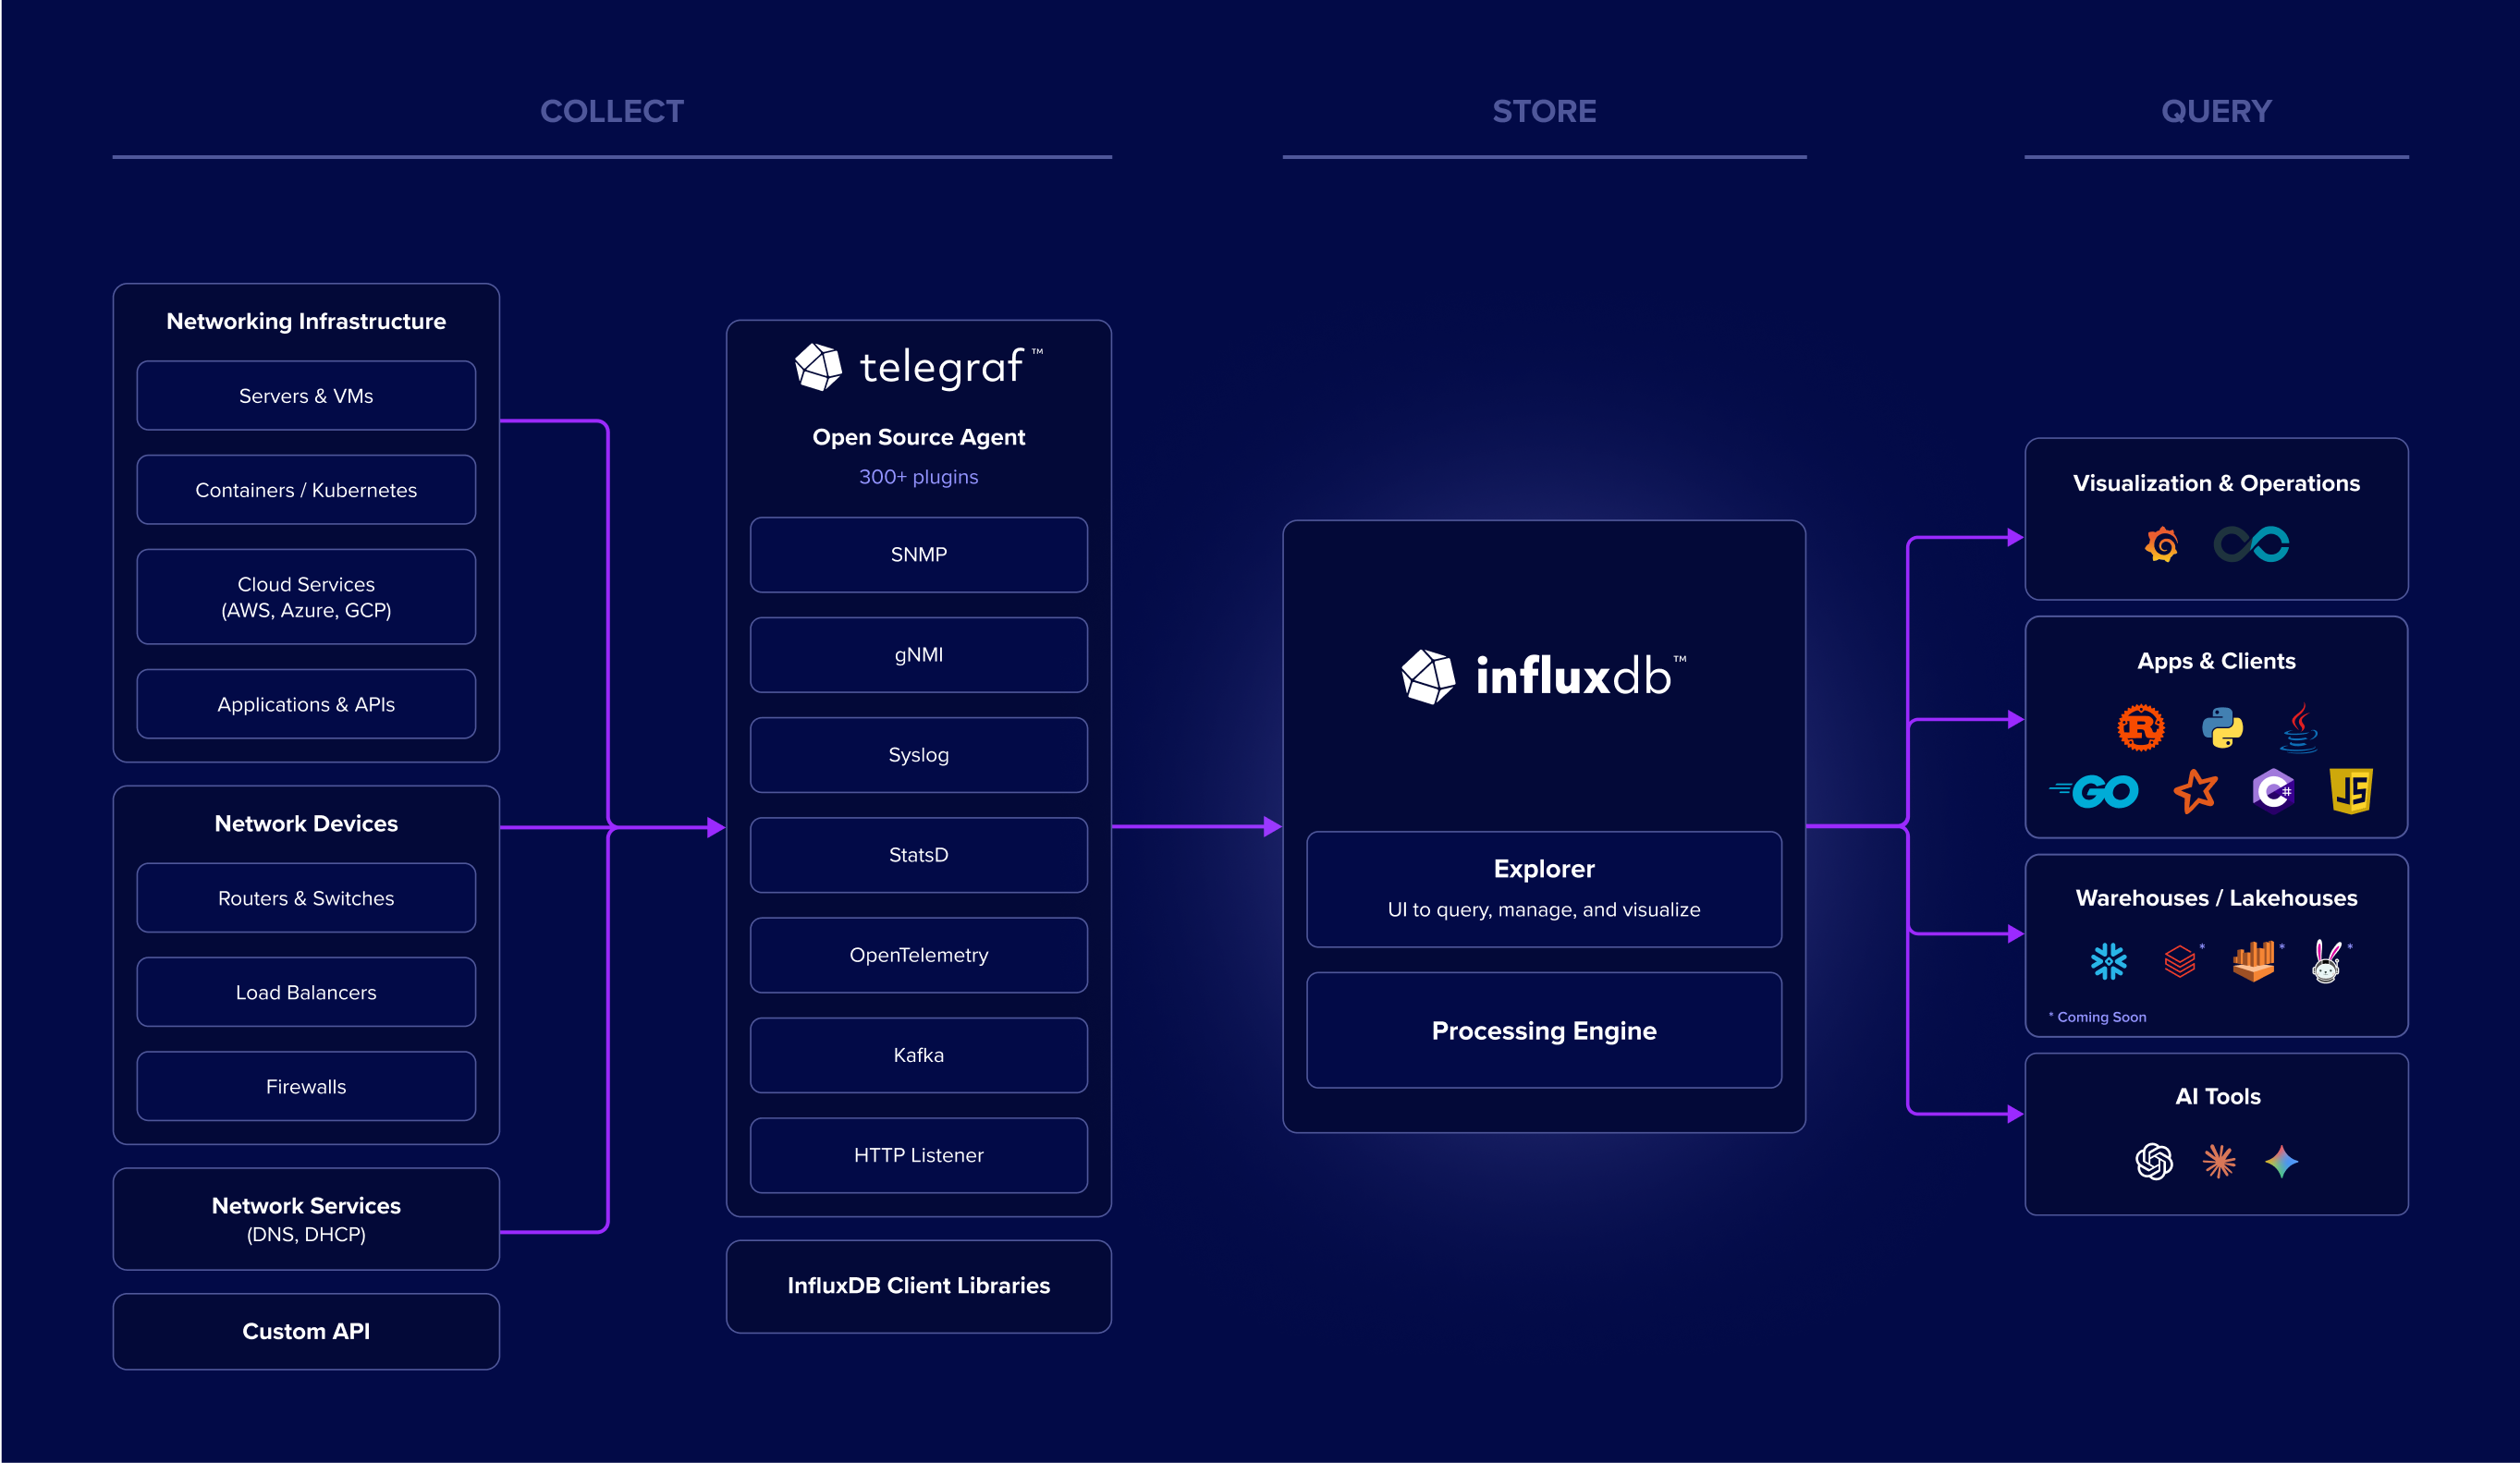
👁 Open-connectivity
Deploy anywhere
Whether you're building on-prem, private cloud, edge, or multi-tenant cloud, InfluxDB meets developers where they are.
Additional resources
Trial for Free
Start free with self-managed, our most popular setup.
Easily install for Linux, Mac, RHEL, Docker:
curl -O https://www.influxdata.com/d/install_influxdb3.sh && sh install_influxdb3.sh enterprise
For Windows installation, see the Getting Started Guide.
By default, trials are 30 days. Need more time? We can help extend it. Contact Us.