 |
VOOZH | about |
|
VOOZH | about |
Web3 is booming right now. Things you can do just using Ethereum smart contracts is on a completely different level; developers are already creating smart contracts on the Ethereum blockchain for multiple use cases, include NFTs, cryptocurrency, collecting payments, and managing data in a decentralized manner.
👁 ImageLike every other programming language, Solidity (the language used to make smart contracts) also needs debugging in order for the application to work properly. Using the Remix IDE, you can find the proper debugging tools so that you can keep track of how the state of the smart contract changes as the code gets executed, see variable values at any given point, and much more. Today, we are going to discuss how to properly debug Solidity contracts.
When you open Remix, navigate to the contracts folder and create a new file named Debugging.sol. Add the following contents to it:
// SPDX-License-Identifier: MIT
pragma solidity ^0.8.4;
contract Debugging {
 uint256 counter;
 constructor(uint256 _counter) {
 counter = _counter;
 }
 function _setCounter(uint256 _counter) internal {
 counter = _counter;
 }
 function increment(uint256 value) public {
 uint256 newValue = counter + value;
 _setCounter(newValue);
 }
 function decrement(uint256 value) public {
 uint256 newValue = counter - value;
 _setCounter(newValue);
 }
 function getCounter() public view returns(uint256) {
 return counter;
 }
}
Above is the code for a basic smart contract written in Solidity. It keeps a track of a counter. I’ve made more functions than strictly required in order to demonstrate the flow of a contract while debugging.
Note that we are using v0.8.4 in this tutorial, but feel free to change the compiler settings to match the version, or use a completely different version if you want.
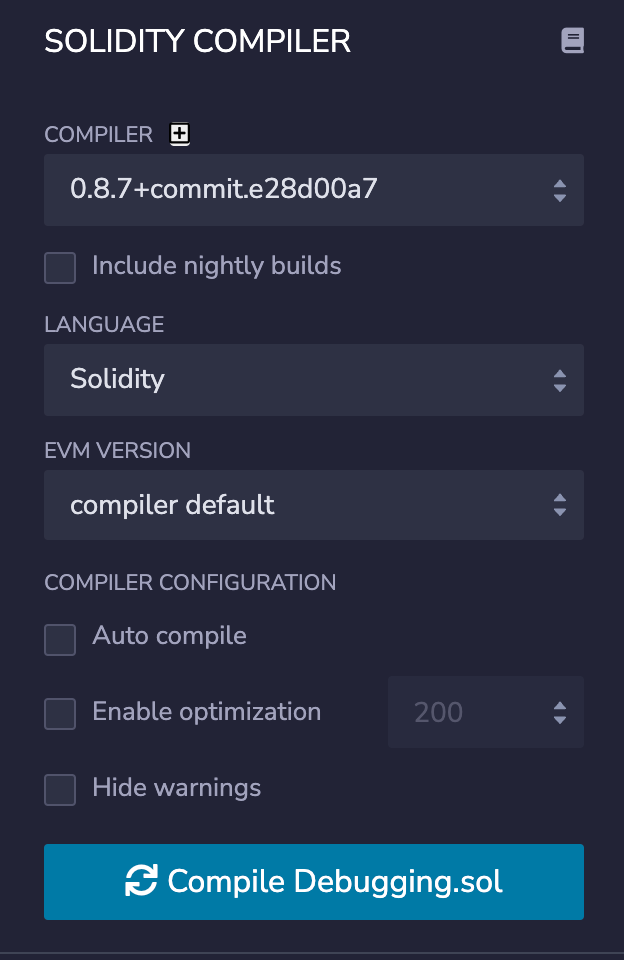
Now go to the compiler tab of the editor, which is the second icon on the sidebar, and you should see the compiler settings.
👁 Screenshot of Solidity compiler
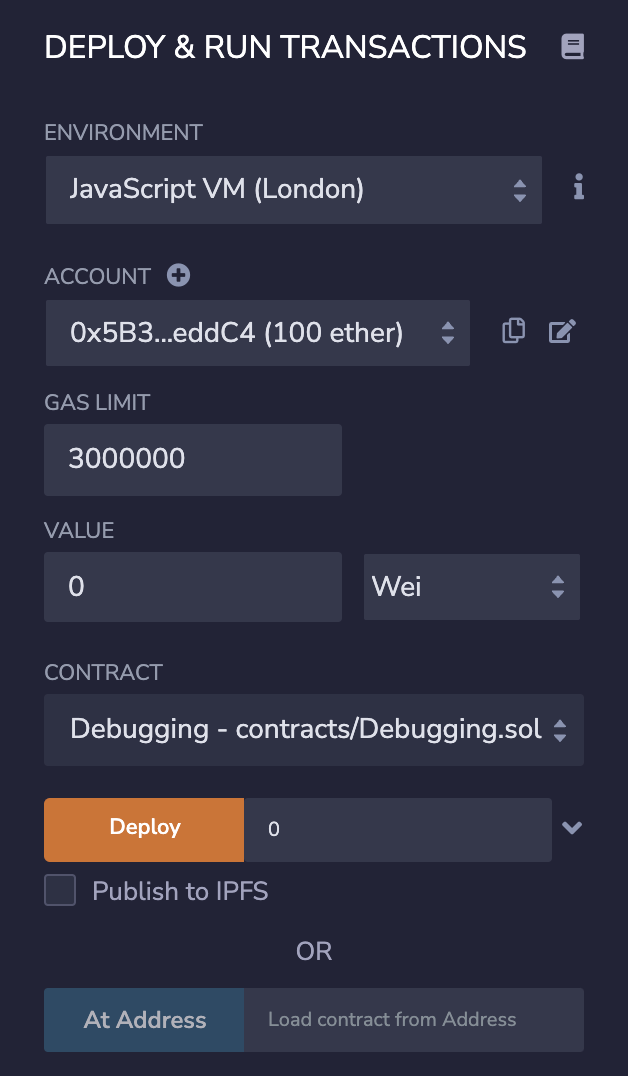
Go ahead and click on Compile Debugging.sol. Now go to the deployment tab, which is the third icon on the sidebar. You will see the deployment tab as shown below:
Make sure the environment is set to one of the JavaScript VMs, we won’t cover deployment to actual networks in this tutorial, but it should work pretty much the same. Add a counter in the constructor field near the Deploy button. I’ve set it to zero, which will set the initial value of the counter.
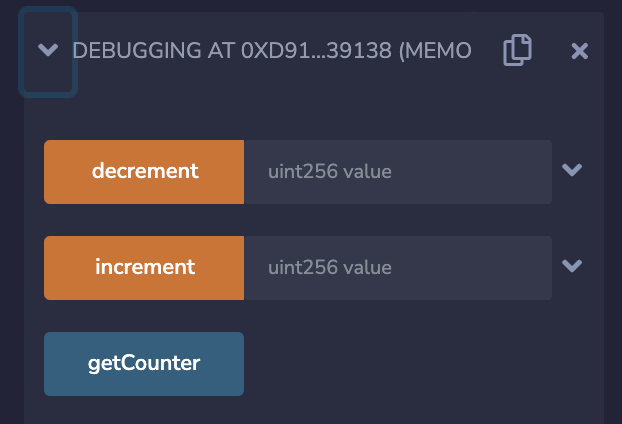
Once you click on Deploy, you should see your smart contracts under the Deployed Contracts section:
These are the functions that we made public in our smart contract and are accessible through these buttons. Using the text boxes near the buttons, you can pass parameters with the function.
Now let’s move on to the fun part, debugging the smart contract. To debug, we first need to create a transaction, which means we need to interact with the part of the smart contract we want to debug.
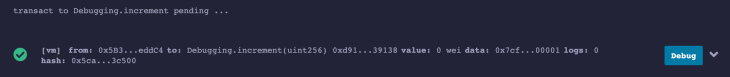
In this case, I’ll use the increment function as an example and pass 1 as the parameter to increase the counter by one. Press the increment function to run the smart contract. When the transaction completes or fails, you will see something like this in the Remix terminal:
👁 Screenshot of pending transaction debugging
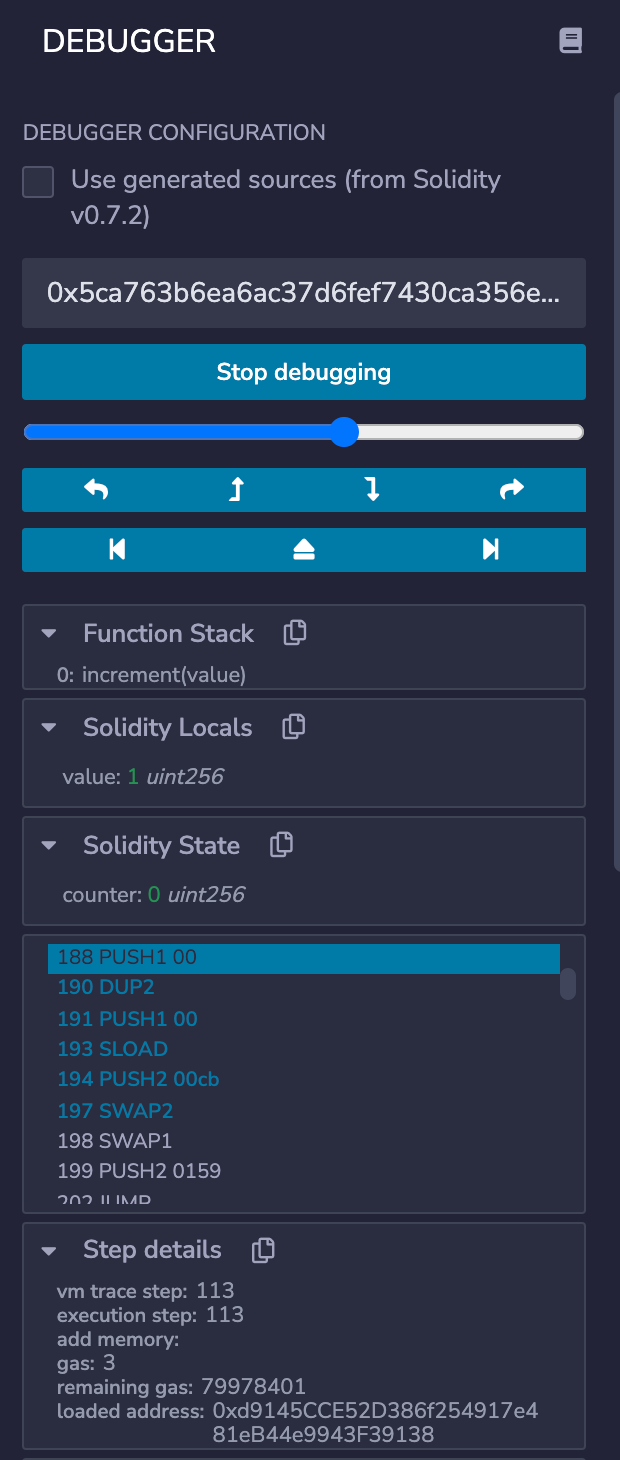
Now, press the Debug button and we will be presented with the debugger:
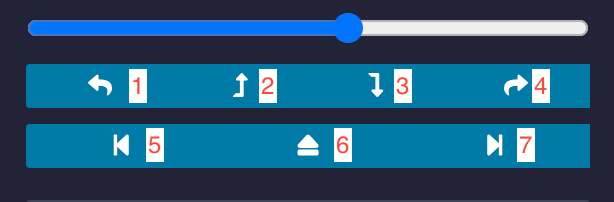
There are a lot of buttons and information in this panel. Let’s see what the buttons mean here:
👁 Slider with numbered arrow buttons
Here are the description of the labels:
You can also use the slider and simulate the transaction as the slider moves.
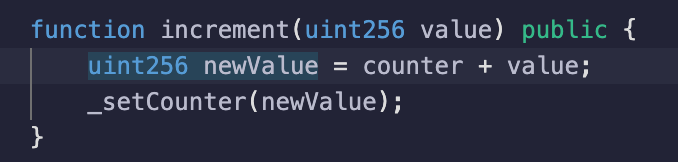
Now let’s debug and see how the flow of the increment function is moving. When you first launch the debugger on this transaction, you should see this part of code highlighted:
This means that the newValue variable is being created. When we press Step into, you should see that the code is highlighted near counter and value, simulating how the addition is working.
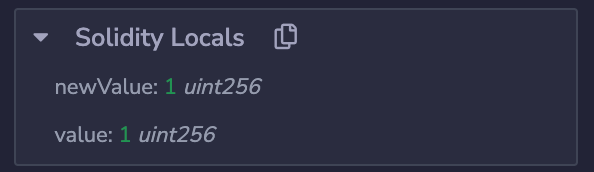
Eventually, after a few steps, you will see the Solidity Locals panel change like this:
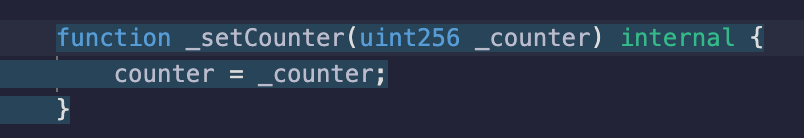
This means that the current value of the newValue (as of this point in the code) is one. A few more steps forward, you will see yourself in an internal function that will be highlighted like this:
👁 Highlighted internal functions
This means that the control is passed to the internal function _setCounter. Now you’ll see the previous Solidity locals have disappeared because they were local variables to the increment function and are not valid in _setCounter.
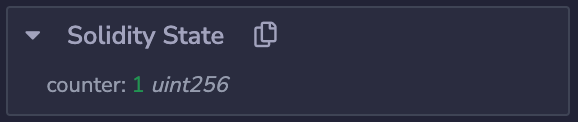
A few more steps, you will see your Solidity State panel changing the initial counter to the new value like this:
At this point we can be sure that this specific line of code changed the state. That’s how you debug Solidity smart contracts! This was the very basic contract, so the debugging was quite easy. In comparatively bigger contracts, you might need to keep track of variables and state all of the time.
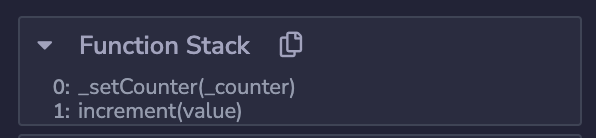
The following are a few more panels that might be useful to you:
You can get a lot of information from this panel, such as which function is currently under execution and which function called it. If there are multiple functions, it will be shown in a stack.
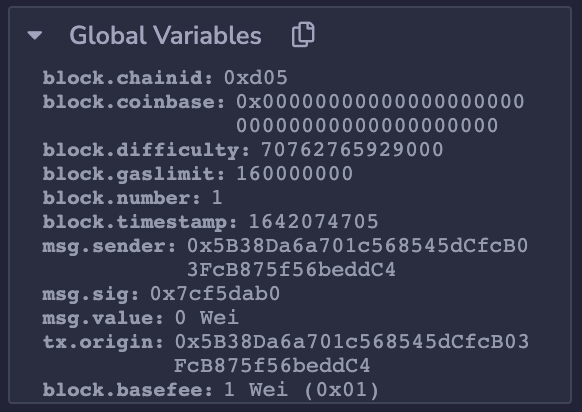
You can keep track of the global variables in the transaction, just in case you need to know the sender or other data from the transaction.
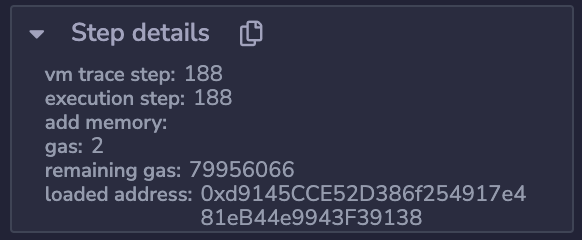
You can get some additional step data here, such as gas used and remaining gas.
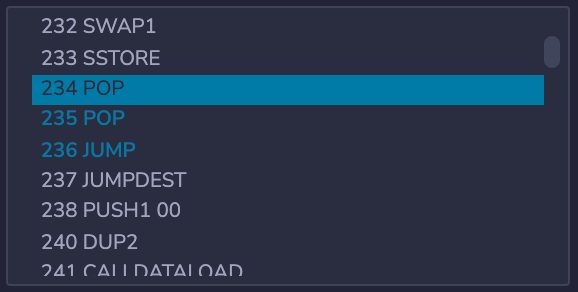
Using the Opcodes, you can get advanced information about the current step of the contract. You can find out when the program performs steps like JUMP.
Knowing how to debug is important, and I’m sure this article gave you an idea on how to debug smart contracts in a proper way. You should still try to experiment with some complex programs, such as sending Ethereum through contracts and see how the flow works out.
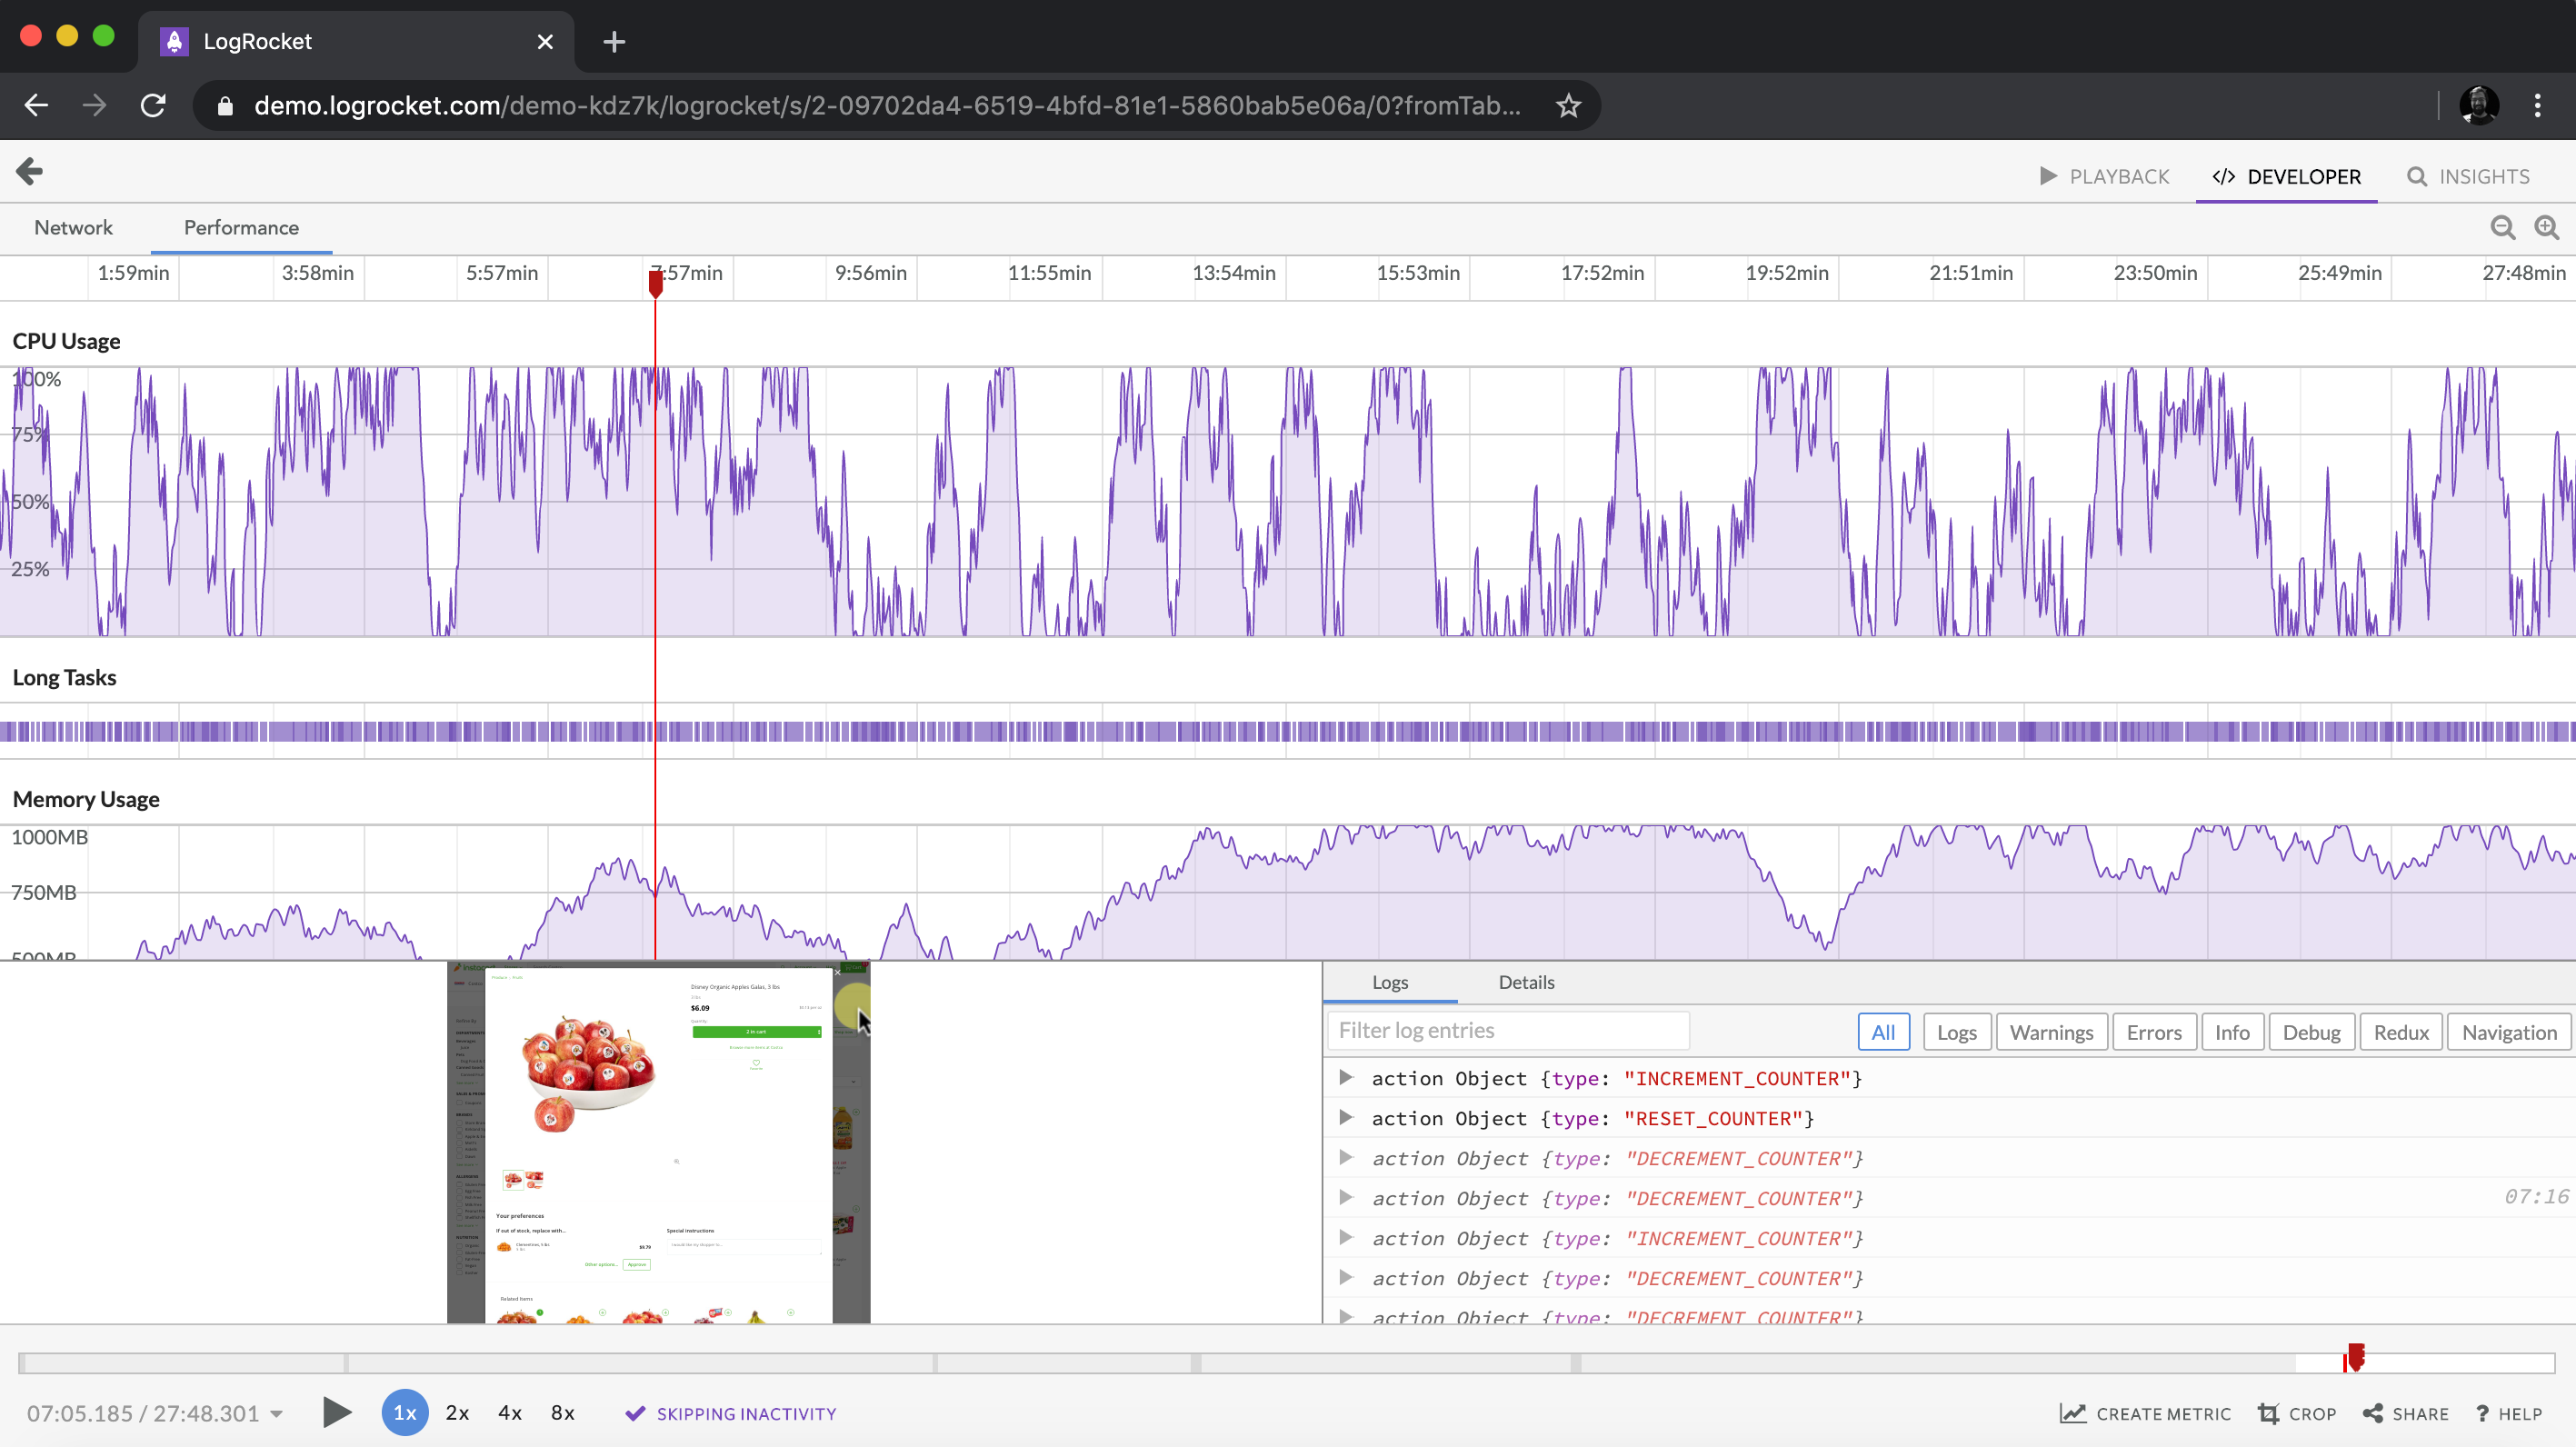
Client-side issues that impact users’ ability to activate and transact in your apps can drastically affect your bottom line. If you’re interested in monitoring UX issues, automatically surfacing JavaScript errors, and tracking slow network requests and component load time, try LogRocket.
👁 LogRocket Dashboard Free Trial BannerLogRocket lets you replay user sessions, eliminating guesswork around why bugs happen by showing exactly what users experienced. It captures console logs, errors, network requests, and pixel-perfect DOM recordings — compatible with all frameworks.
LogRocket's Galileo AI watches sessions for you, instantly identifying and explaining user struggles with automated monitoring of your entire product experience.
Modernize how you debug web and mobile apps — start monitoring for free.
From RSC vulnerabilities and the Vercel breach to TypeScript 7.0 Beta and AI agents — the nine frontend storylines that defined H1 2026, ranked.
AI tools generate working React code fast, but miss race conditions, empty states, debouncing, and accessibility. Here’s how to catch bugs before production.
Learn how to use Gemini CLI subagents to delegate frontend, backend, testing, and docs tasks to specialized agents with guardrails and clear ownership.
Learn how next-browser gives AI agents runtime context for debugging Next.js apps, including React props, hydration, PPR, forms, and performance.
Hey there, want to help make our blog better?
Join LogRocket’s Content Advisory Board. You’ll help inform the type of content we create and get access to exclusive meetups, social accreditation, and swag.
Sign up now