 |
VOOZH | about |
|
VOOZH | about |
Console logs are a very important concept to any JavaScript developer, and they may even be more important to React Native developers. When anything goes wrong in an app, console.log() is the only statement we use to try and figure out what’s wrong in our code.
When it comes to debugging, console logs are really insightful, helping you examine the real-time data that an app is using at any point of execution. However, having too many console logs can confuse the developer to the point that no log is recognizable. Many developers don’t give a proper description to their logs, and their terminal turns out to be something like this:
i am here
just got executed
brooo why this doesnt run
i hate programming
this should run
[Object object]
12345
iiiiiiiiiiiiiiii
One day, your project might be transferred to another developer, so it’s crucial to have readable console logs that can help the next developer understand what’s happening in any specific part of the code.
In this article, we‘ll review the different ways of implementing console logs in React Native to keep things more organized and readable. To follow along with this article, you’ll need to have basic knowledge of React Native, either on Expo or using the React Native CLI. Let’s get started!
The Replay is a weekly newsletter for dev and engineering leaders.
Delivered once a week, it's your curated guide to the most important conversations around frontend dev, emerging AI tools, and the state of modern software.
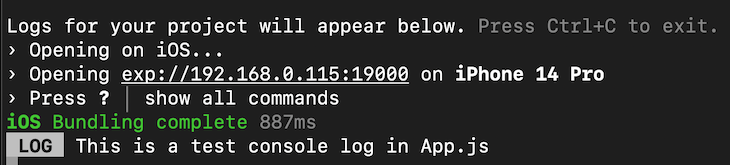
Regardless of whether you’re working on an emulator or a physical device, your console logs will show up in the Metro Bundler terminal, which opens immediately when you run your app. For example, imagine you use the following console log in your code:
console.log("This is a test console log in App.js");
It will show up in your terminal as follows:
👁 Console Logs Metro Bundler Terminal
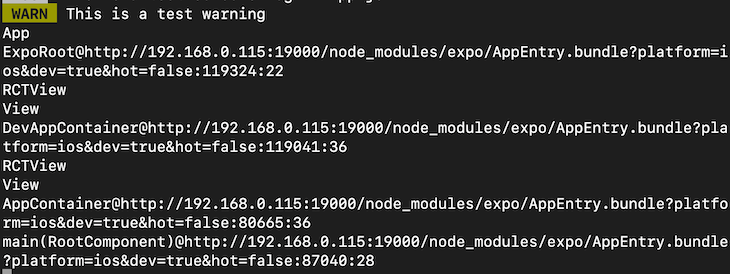
Notice how React Native puts LOG before the actual console log text. You can alter this using different console log types. Let’s look at how warnings are displayed on the console:
console.warn("This is a test warning");
warn() is a method similar to log() in the console object. It should produce a similar output to a regular log, however, it should include a warning label:
👁 Warn Console Log Output Warning Label
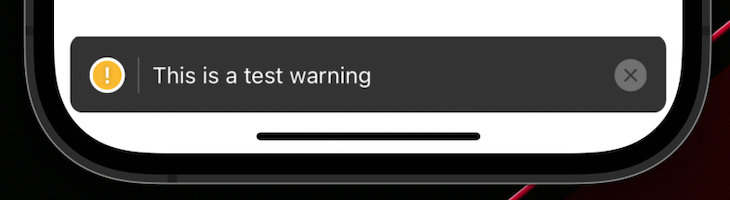
Along with the warning text itself, React Native also logs out where exactly this warning was triggered. React Native also sends this warning to the connected device in addition to the warning on the console:
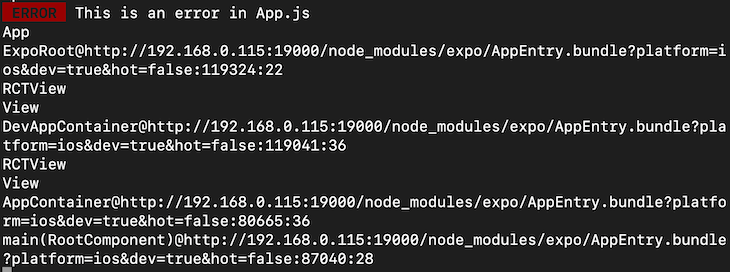
You can do the same with errors:
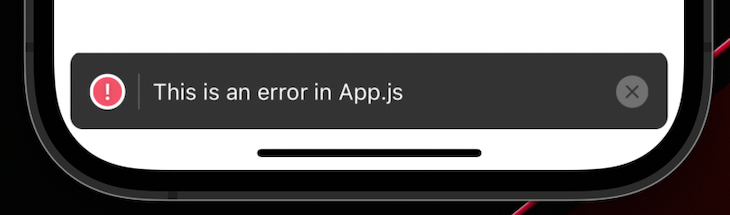
console.error("This is an error in App.js");
This should output a log with the label ERROR in the logs:
Similarly, the error is also displayed on the device as follows:
Apart from the regular built-in console.log() method, you can install custom packages that give you more control over your console logs and make debugging easier and more organized. Let’s look at an example; we’ll install react-native-logs into our React Native app. Run the following command in your terminal:
#npm
npm install react-native-logs

#yarn
yarn add react-native-logs
The command above will install all the dependencies needed to use the react-native-logs package. Now, you can import the package using the following line:
import { logger } from "react-native-logs";
You can initialize the logger by using the following code snippet outside of the component or in some other file:
const log = logger.createLogger();
Now, you can simply use the methods provided by the package to create a simple log on the console:
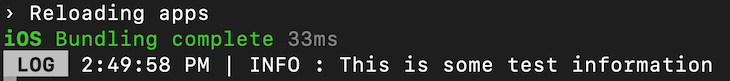
log.info("This is some test information");
This should provide an output similar to the following:
👁 React Native Logs Methods Output
Notice that this package automatically adds the time for the log along with the message of the log itself. Now, let’s try the same thing for warnings and errors and see what the output is:
log.warn("This is some test warning in App.js");
log.error("This is some test error in App.js");
The code snippet above should give an output similar to the following:
👁 React Native Logs Output Warnings
Currently, there are no colors here because this is the default logger configuration. We can also use custom logger configurations to give these console logs some color.
Let’s add some configuration in our logger.createLogger() method:
const log = logger.createLogger({
 transportOptions: {
 colors: {
 info: "blueBright",
 warn: "yellowBright",
 error: "redBright",
 debug: "white",
 },
 },
});
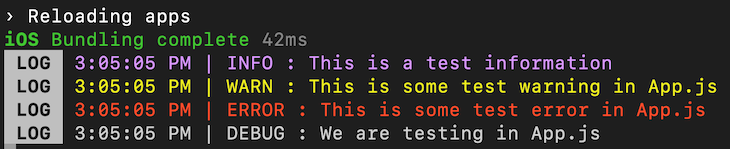
In the code snippet above, we are providing different colors for different levels of console log severities. Let’s try some console logs now:
log.info("This is a test information");
log.warn("This is some test warning in App.js");
log.error("This is some test error in App.js");
log.debug("We are testing in App.js");
The code snippet above should give the following output:
👁 Color Coding Warning Severities
Note that the colors might vary depending on your terminal configuration. In my case, blueBright is being shown as a purple color.
We can add custom severity levels apart from the default ones, like debug, info, warn, and error. To do so, we need to define the levels and the severities in the logger.createLogger() method:
const log = logger.createLogger({
 levels: {
 custom: 0,
 debug: 1,
 info: 2,
 warn: 3,
 error: 4,
 devNotice: 5,
 },
 transportOptions: {
 colors: {
 custom: "white",
 devNotice: "blue",
 info: "blueBright",
 warn: "yellowBright",
 error: "redBright",
 debug: "white",
 },
 },
});
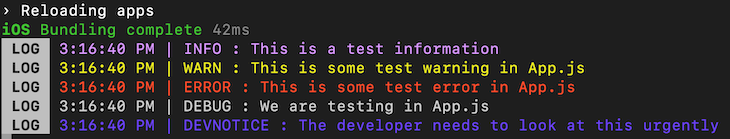
In the code above, we have defined our levels and severity, with 0 being the least severe. When you use custom levels, you need to define the default severities if you wish to use them. Using custom levels overrides the default levels.
Now, let’s put this to test:
log.custom("This is a custom log");
log.info("This is a test information");
log.warn("This is some test warning in App.js");
log.error("This is some test error in App.js");
log.debug("We are testing in App.js");
log.devNotice("The developer needs to look at this urgently");
The code above should provide the following output:
👁 React Native Logs Custom Errors
In a production environment, many developers output their app logs to a file. Therefore, if anything goes wrong, the user can provide the developer with logs that they can use to resolve issues in the app. When using react-native-logs, it’s possible to output your logs in a file.
Depending on whether you’re using Expo or the React Native CLI, you need to install the file system package to access the device file system:
# Expo
npm install expo-file-system

# React Native CLI
npm install react-native-fs
Then, you can import the packages as follows:
// Expo
import * as FileSystem from "expo-file-system";

// React Native CLI
import FileSystem from "react-native-fs";
You can use the following configuration in your logger.createLogger() method:
const log = logger.createLogger({
 transport: fileAsyncTransport,
 levels: {
 custom: 0,
 debug: 1,
 info: 2,
 warn: 3,
 error: 4,
 devNotice: 5,
 },
 transportOptions: {
 FS: FileSystem,
 fileName: "logs.txt",
 },
});
Note that fileAsyncTransport is imported from the react-native-logs package along with the createLogger() method. In the code snippet above, we are specifying a file transport method, meaning that all of our logs will be outputted in a file instead.
In transportOptions, we specify a file system based on whether we’re using Expo or the React Native CLI. Finally, we are also providing a name for the logs file.
Now, in the file system of your device, you should get a text file with an output similar to the following code depending on which OS you are using:
3:21:32 PM | DEVNOTICE : The developer needs to look at this urgently
3:22:49 PM | INFO : This is a test information
3:22:49 PM | WARN : This is some test warning in App.js
3:22:49 PM | ERROR : This is some test error in App.js
3:22:49 PM | DEBUG : We are testing in App.js
This log can now be uploaded or shared with the developer to examine the application flow and potentially eliminate any bugs.
Console logs are very important, and if used correctly, can help the developer solve a lot of problems quickly. Using something like file logging can also help post-deployment support for the app. I definitely recommend playing around with the configuration and exploring more about the package. I hope you enjoyed this article, and happy coding!
LogRocket's Galileo AI watches sessions for you and and surfaces the technical and usability issues holding back your React Native apps.
LogRocket also helps you increase conversion rates and product usage by showing you exactly how users are interacting with your app. LogRocket's product analytics features surface the reasons why users don't complete a particular flow or don't adopt a new feature.
Start proactively monitoring your React Native apps — try LogRocket for free.
AI tools generate working React code fast, but miss race conditions, empty states, debouncing, and accessibility. Here’s how to catch bugs before production.
Learn how to use Gemini CLI subagents to delegate frontend, backend, testing, and docs tasks to specialized agents with guardrails and clear ownership.
Learn how next-browser gives AI agents runtime context for debugging Next.js apps, including React props, hydration, PPR, forms, and performance.
Build dynamic LLM routing in Next.js with OpenRouter, TanStack AI, task classification, model fallbacks, and cost-aware routing.
Hey there, want to help make our blog better?
Join LogRocket’s Content Advisory Board. You’ll help inform the type of content we create and get access to exclusive meetups, social accreditation, and swag.
Sign up now