 |
VOOZH | about |
|
VOOZH | about |
This article discusses the basics of linear regression and its implementation in the C++ programming language. Regression analysis is the common analysis method that is used by data scientists for the prediction of values corresponding to some input data.
The simple regression analysis method is linear regression. Linear regression is a statistical method for modeling relationships between a dependent variable with a given set of independent variables. We are going to implement the same in C++.
The input data set generally comes in a .csv (comma-separated values) file which we will copy from that file and put in a .txt file as an input file for our C++ program. To take input from a file create an input.txt named file in the same directory as the program file and put the data inside that file such that the first line has the value of N i.e the number of entries in that dataset.
Implementation :
Content of input.txt file is:
84
1714, 2.4
1664, 2.52
1760, 2.54
1685, 2.74
1693, 2.83
1670, 2.91
1764, 3
1764, 3
1792, 3.01
1850, 3.01
1735, 3.02
1775, 3.07
1735, 3.08
1712, 3.08
1773, 3.12
1872, 3.17
1755, 3.17
1674, 3.17
1842, 3.17
1786, 3.19
1761, 3.19
1722, 3.19
1663, 3.2
1687, 3.21
1974, 3.24
1826, 3.28
1787, 3.28
1821, 3.28
2020, 3.28
1794, 3.28
1769, 3.28
1934, 3.28
1775, 3.29
1855, 3.29
1880, 3.29
1849, 3.31
1808, 3.32
1954, 3.34
1777, 3.37
1831, 3.37
1865, 3.37
1850, 3.38
1966, 3.38
1702, 3.39
1990, 3.39
1925, 3.4
1824, 3.4
1956, 3.4
1857, 3.41
1979, 3.41
1802, 3.41
1855, 3.42
1907, 3.42
1634, 3.42
1879, 3.44
1887, 3.47
1730, 3.47
1953, 3.47
1781, 3.47
1891, 3.48
1964, 3.49
1808, 3.49
1893, 3.5
2041, 3.51
1893, 3.51
1832, 3.52
1850, 3.52
1934, 3.54
1861, 3.58
1931, 3.58
1933, 3.59
1778, 3.59
1975, 3.6
1934, 3.6
2021, 3.61
2015, 3.62
1997, 3.64
2020, 3.65
1843, 3.71
1936, 3.71
1810, 3.71
1987, 3.73
1962, 3.76
2050, 3.81
Output:
The best fitting line is y = 0.00165565x + 0.27511
Predicted value at 2060 = 3.68575
The errorSquared = 3.63727
Error in 2050 = 0.140807
Explanation:
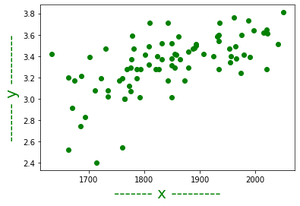
1. If all the data items into a graph are plotted then we will get several points in the graph, now the best fitting line is a line that is closest to every point on the graph.
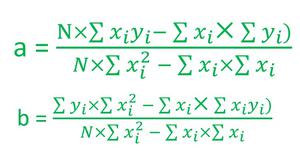
2. Next task is to find the best fitting line. As any straight line can be represented in the form of y = ax + b, where a is the coefficient or slope of the line and b is the constant term.
3. So to find the best fitting line calculate the values of a and b. There is a straightforward formula for calculating the values of a and b which looks like the below ones-
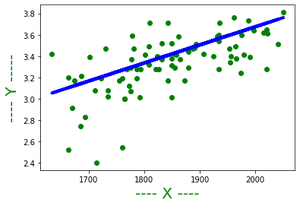
4. After the value of a and b is calculated one can represent the line on the graph as: