 |
VOOZH | about |
|
VOOZH | about |
Linear Regression is a supervised machine learning algorithm used to predict continuous values by modelling the relationship between input features and output using a best-fit straight line.
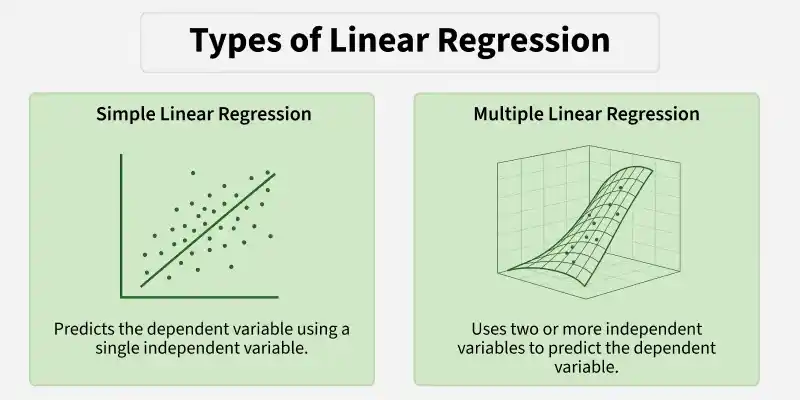
Linear Regression is mainly of two types:
Simple Linear Regression is a supervised learning algorithm used to predict a continuous target variable using a single input feature. It assumes a linear relationship between the input and output and represents it using a straight line.
Step 1: Import Libraries
Import the required libraries NumPy for numerical operations and Matplotlib for visualization.
Step 2: Implement Simple Linear Regression Class
Define a SimpleLinearRegression class to model the relationship between a single input feature and a target variable using a linear equation.
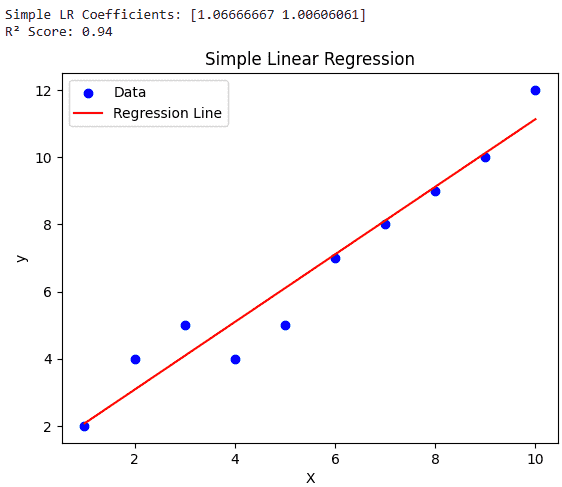
Step 3: Fit the Model and Visualize Results
Fit the model to training data and compute coefficients along with R² score and and plot the data points along with the best-fit regression line.
Output:
Multiple Linear Regression is used to predict a continuous target variable based on two or more input features, assuming a linear relationship between the inputs and the output.
Step 1: Import Libraries
Import NumPy for numerical operations, Matplotlib for plotting and mpl_toolkits.mplot3d to create 3D visualizations.
Step 2: Implement Multiple Linear Regression Class
Here we implement a Multiple Linear Regression class to model the relationship between multiple input features and a continuous target variable using a linear equation.
__init__ method: Initializes coefficients (slopes), intercept (bias), and R² score for model evaluation. fit method: Adds bias term, computes coefficients using the Normal Equation, predicts outputs, and calculates R² score. predict method: Adds bias to input data and generates predictions using learned coefficients.Step 3: Generate Sample Dataset
We create a small dataset with two input features and a target variable, adding noise to simulate real-world data.
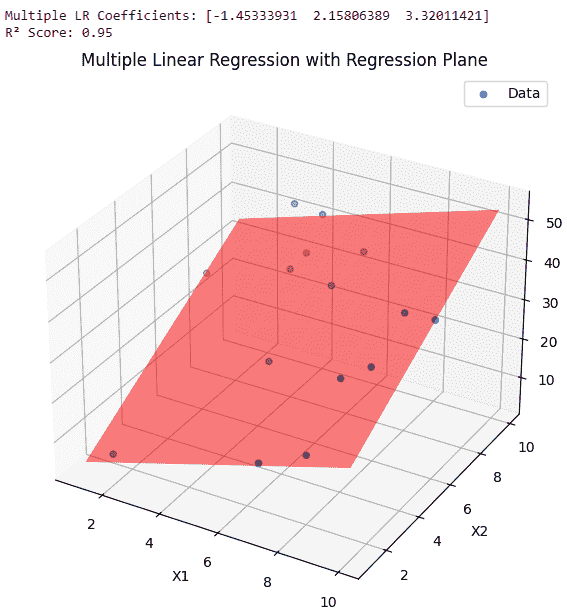
Step 4: Fit the Model and Visualize
We train the Multiple Linear Regression model on the dataset, print coefficients and R² score, and visualize the regression plane in 3D.
Output:
Download code from here.