 |
VOOZH | about |
|
VOOZH | about |
Logistic Regression is a supervised machine learning algorithm used for classification problems. Unlike linear regression, which predicts continuous values it predicts the probability that an input belongs to a specific class.
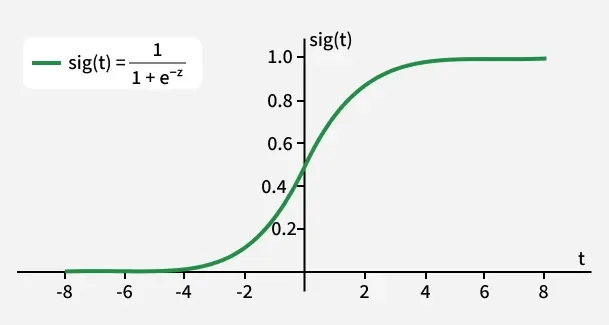
1. The sigmoid function is a key component of Logistic Regression that converts the model's raw output into a probability value between 0 and 1.
2. This function takes any real number and maps it into the range 0 to 1 forming an "S" shaped curve called the sigmoid curve or logistic curve. Because probabilities must lie between 0 and 1, the sigmoid function is perfect for this purpose.
3. In logistic regression, we use a threshold value usually 0.5 to decide the class label.
This approach helps to transform continuous input values into meaningful class predictions.
Logistic regression computes a linear combination of input features (z = w·X + b) and passes it through a sigmoid function to produce a probability between 0 and 1. This probability is then used to assign the input to a class.
Suppose we have input features represented as a matrix:
and the dependent variable is having only binary value i.e 0 or 1.
then, apply the multi-linear function to the input variables X.
Here is the observation of X, is the weights or Coefficient and is the bias term also known as intercept. Simply this can be represented as the dot product of weight and bias.
At this stage, is a continuous value from the linear regression. Logistic regression then applies the sigmoid function to to convert it into a probability between 0 and 1 which can be used to predict the class.
Now we use the sigmoid function where the input will be z and we find the probability between 0 and 1. i.e. predicted y.
As shown above the sigmoid function converts the continuous variable data into the probability i.e between 0 and 1.
where the probability of being a class can be measured as:
It models the odds of the dependent event occurring which is the ratio of the probability of the event to the probability of it not occurring:
Taking the natural logarithm of the odds gives the log-odds or logit:
then the final logistic regression equation will be:
This formula represents the probability of the input belonging to Class 1.
The goal is to find weights and bias that maximize the likelihood of observing the data.
For each data point
Taking natural logs on both sides:
This is known as the log-likelihood function.
To find the best and we use gradient ascent on the log-likelihood function. The gradient with respect to each weight is:
Logistic regression can be implemented in Python for the following two types:
In binomial logistic regression, the target variable can only have two possible values such as "0" or "1", "pass" or "fail". The sigmoid function is used for prediction.
We will be using Scikit-learn library for this and shows how to use the breast cancer dataset to implement a Logistic Regression model for classification.
Output:
Logistic Regression model accuracy (in %): 96.49%
This code uses logistic regression to classify whether a sample from the breast cancer dataset is malignant or benign.
Target variable can have 3 or more possible types which are not ordered i.e types have no quantitative significance like “disease A” vs “disease B” vs “disease C”.
In this case, the softmax function is used in place of the sigmoid function. Softmax function for K classes will be:
Here represents the number of elements in the vector and iterates over all the elements in the vector.
Then the probability for class will be:
Below is an example of implementing multinomial logistic regression using the Digits dataset from scikit-learn:
Output:
Logistic Regression model accuracy: 96.66%
This model is used to predict one of 10 digits (0-9) based on the image features.
Evaluating the logistic regression model helps assess its performance and ensure it generalizes well to new, unseen data. The following metrics are commonly used:
1. Accuracy: Accuracy provides the proportion of correctly classified instances.
2. Precision:Precision focuses on the accuracy of positive predictions.
3. Recall (Sensitivity or True Positive Rate):Recall measures the proportion of correctly predicted positive instances among all actual positive instances.
4. F1 Score: F1 score is the harmonic mean of precision and recall.
5. Area Under the Receiver Operating Characteristic Curve (AUC-ROC): The ROC curve plots the true positive rate against the false positive rate at various thresholds. AUC-ROC measures the area under this curve which provides an aggregate measure of a model's performance across different classification thresholds.
6. Area Under the Precision-Recall Curve (AUC-PR): Similar to AUC-ROC, AUC-PR measures the area under the precision-recall curve helps in providing a summary of a model's performance across different precision-recall trade-offs.
| Aspect | Linear Regression | Logistic Regression |
|---|---|---|
| Definition | Linear regression is used to predict the continuous dependent variable using a given set of independent variables. | Logistic regression is used to predict the categorical dependent variable using a given set of independent variables. |
| Problem Type | It is used for solving regression problem. | It is used for solving classification problems. |
| Output Type | In this we predict the value of continuous variables. | In this we predict values of categorical variables. |
| Curve/Model Fitting | In this we find best fit line. | In this we find S-Curve. |
| Estimation Method | Least square estimation method is used for estimation of accuracy. | Maximum likelihood estimation method is used for estimation of accuracy. |
| Output Example | The output must be continuous value such as price, age etc. | Output must be categorical value such as 0 or 1, Yes or No, etc. |