Bias and Variance are two fundamental concepts that help explain a model’s prediction errors in machine learning. Bias refers to the error caused by oversimplifying a model while variance refers to the error from making the model too sensitive to training data.
Understanding this balance is essential for building models that generalize well to unseen data.
Bias
Bias is the error that occurs when a model is too simple to capture the true patterns in the data.
High bias: The model oversimplifies, misses patterns and underfits the data.
Low bias: The model captures patterns well and is closer to the true values.
Example: A neural network with too few layers or neurons fails to capture complex patterns, producing consistently inaccurate outputs. This is called underfitting.
Mathematically, the formula for bias is:
Where,
: predicted value by the model
: true value
: expected prediction over different training sets
How to Reduce Bias?
Some methods to lower bias in models are:
Use More Complex Models: Use models capable of capturing non-linear relationships such as neural networks or ensemble methods.
Add Relevant Features: Include additional informative features in the training data to give the model for capturing underlying patterns.
Adjust Regularization Strength: Reduce regularization to allow the model more flexibility in fitting the data.
Variance
Variance arises when a model becomes too sensitive to training data and it captures noises in data too. It fails to give prediction on unseen new data.
High variance: The model is too sensitive to small changes and may overfit.
Low variance: The model is more stable but might miss some patterns.
Example: A deep decision tree that memorizes the training data perfectly but performs poorly on new data shows high variance, this is known as overfitting.
Mathematically, the formula for variance is:
Where,
: predicted value by the model
: average prediction over multiple training sets
How to Reduce Variance?
Some methods to lower variance are:
Simplify the Model: Use a simpler model or prune overly deep decision trees to avoid overfitting.
Increase Training Data: Collect more data to stabilize learning and make the model generalize better.
Apply Regularization: Use L1 or L2 regularization to constrain model complexity and prevent overfitting.
Use Ensemble Methods: Implement techniques like bagging or random forests to combine multiple models and balance bias–variance trade-offs.
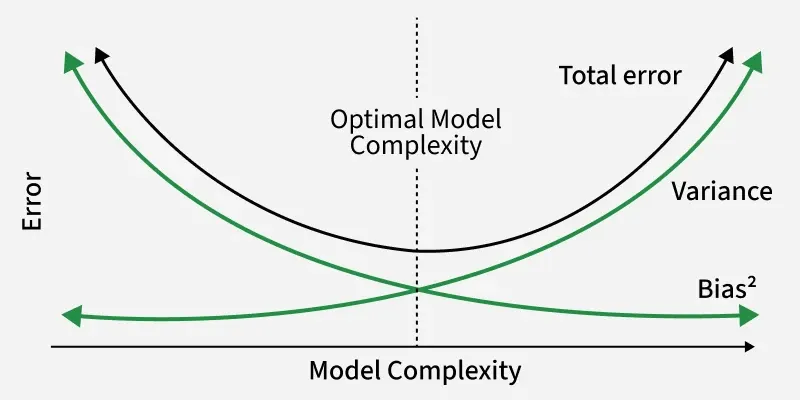
Bias Variance Tradeoff
The total prediction error depends on the tradeoff between bias and variance:
Model Type
Bias
Variance
Result
Underfitting
High
Low
Poor training and test performance
Optimal
Moderate
Moderate
Best generalization
Overfitting
Low
High
Poor test performance
An ideal model achieves a balance of model not being too simple i.e. high bias, not too complex i.e. high variance.
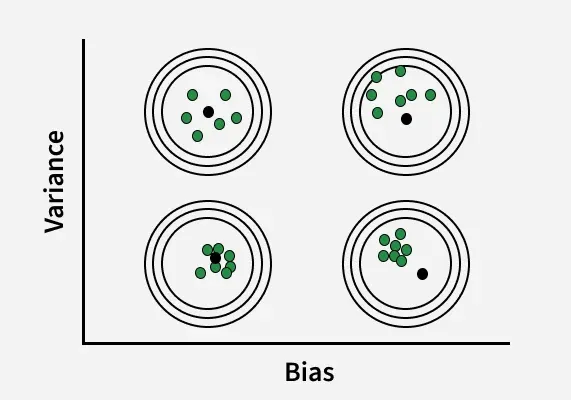
Visualization
A simple way to understand bias and variance is with a dartboard analogy:
High Bias: Darts are clustered together but far from the target center.
High Variance: Darts are scattered all over the board.
Low Bias and Low Variance: Darts are tightly grouped near the center, showing accurate and consistent predictions.
