 |
VOOZH | about |
|
VOOZH | about |
Cross-tabulation is a statistical technique used to summarize the relationship between categorical variables in a table format. It displays data in rows and columns, where each cell represents the frequency of a category combination.
Cross-tabulation structures categorical data into a table by counting occurrences for each combination of categories. This makes relationships and patterns between variables easy to compare and interpret.
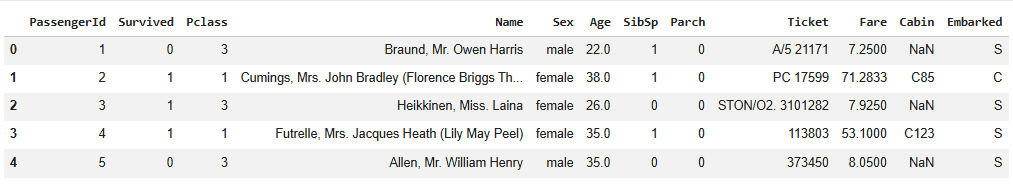
Here we implement cross-tabulation in Python using the Pandas library to analyze relationships between categorical variables.
Import Pandas library and load Dataset
You can download dataset from here
Output:
In this step, we select Pclass and Sex as categorical variables and Survived as the target variable to analyze survival patterns across passenger groups.
Output:
Pclass unique values: [3 1 2]
Sex unique values: ['male' 'female']
Survived unique values: [0 1]
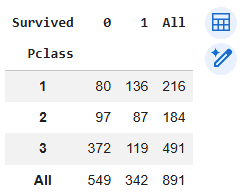
Here we use the pd.crosstab() function to create a frequency table showing survival counts across passenger classes. The margins parameter adds row and column totals.
Output:
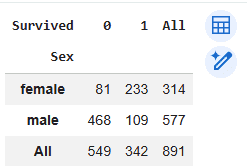
In this step we analyze survival outcomes based on gender using another cross-tabulation table.
Output:
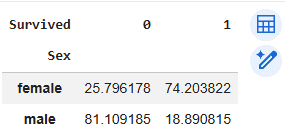
Instead of looking only at raw counts, the table can be normalized to show survival percentages. This makes it easier to compare survival chances across different categories.
Output:
You can download full code from here.