 |
VOOZH | about |
|
VOOZH | about |
Pandas is an open-source Python library used for data manipulation, analysis and cleaning. It provides fast and flexible tools to work with tabular data, similar to spreadsheets or SQL tables.
Pandas is used in data science and analytics due to its integration with libraries such as:
Pandas allows efficient handling and analysis of data in a few lines of code.
Before using Pandas, make sure it is installed:
pip install pandas
After the Pandas have been installed in the system we need to import the library. The Pandas library can be imported using:
import pandas as pd
Note: pd is just an alias for Pandas. It’s not required but using it makes the code shorter when calling methods or properties.
Pandas provides two data structures for manipulating data which are as follows:
A Pandas Series is a one-dimensional labeled array capable of holding data of any type. It can be created from Python lists, NumPy arrays, dictionaries, scalar values or data loaded from external sources such as CSV files, Excel files and databases. The labels associated with a Series are called its index.
Pandas Series:
0 g
1 e
2 e
3 k
4 s
dtype: object
Explanation:
Pandas DataFrame is a two-dimensional data structure with labeled axes (rows and columns). It is created by loading the datasets from existing storage which can be a SQL database, a CSV file or an Excel file. It can be created from lists, dictionaries, a list of dictionaries etc.
Empty DataFrame
Columns: []
Index: []
 0
0 Geeks
1 For
2 Geeks
3 is
4 portal
5 for
6 Geeks
Pandas provides essential operations for working with structured data efficiently. The sections below introduce the most commonly used functionalities with short explanations and simple examples.
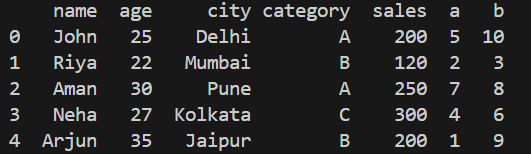
1. Loading Data: This operation reads data from files such as CSV, Excel or JSON into a DataFrame.
Output
Explanation: pd.read_csv("data.csv") reads the CSV file and loads it into a DataFrame and df.head() shows the first 5 rows of the data.
You can download the data.csv file from here
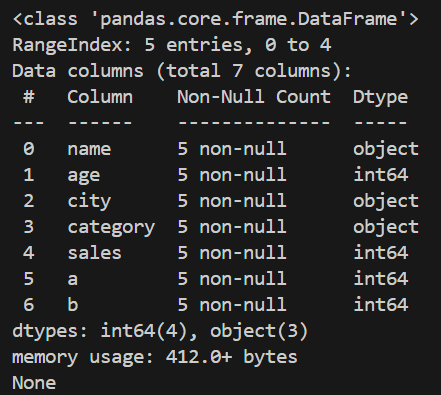
2. Viewing and Exploring Data: After loading data, it is important to understand its structure and content. This methods allow you to inspect rows, summary statistics and metadata.
Output
Explanation: df.info() displays information about the DataFrame, including column names, data types, non-null counts, and memory usage.
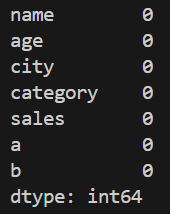
3. Handling Missing Data: Datasets often contain empty or missing values. Pandas provides functions to detect, remove or replace these values.
Output
Explanation: df.fillna(0) replaces missing values with 0.
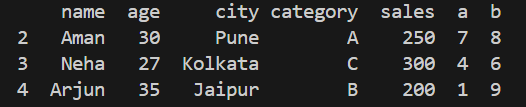
4. Selecting and Filtering Data: This operation retrieves specific columns, rows or records that match a condition. It allows precise extraction of required information.
Output
Explanation: df[df['age'] > 25] returns rows where the "age" value is greater than 25.
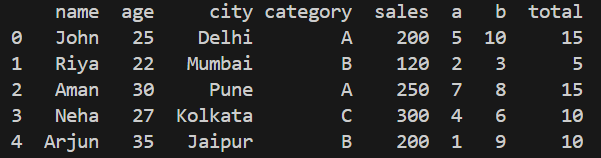
5. Adding and Removing Columns: You can create new columns based on existing ones or delete unwanted columns from the DataFrame.
Output
Explanation:df['total'] = df['a'] + df['b'] creates a new column named "total".
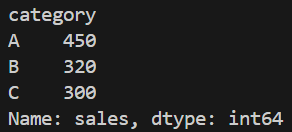
6. Grouping Data (GroupBy): Grouping allows you to organize data into categories and compute values for each group for example, sums, counts or averages.
Output
Explanation: df.groupby('category') divides the dataset based on the "category" column.
To learn Pandas from basic to advanced refer to Pandas tutorial