In Jupyter Notebook, when we print the output table of our data, it shows a very basic table containing the data. But what if we want to customize this default style? In this article, we will see how we can add styles to our output data table.
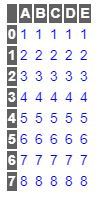
This is how a default data table looks like in Jupyter Notebook:
Output:
👁 Image
Now let's try to change the style. We can do it by the
set_table_styles method of pandas module.
df.style.set_table_styles()
Now we need to pass the 'selectors' and 'props' as argument to this method, i.e. we need to select the CSS tags of the table (eg: th, td etc) and change the values of their properties (eg: background, font-color, font-family etc).
So, if we need to change the font-family of the text in the data section of the table, we can do it like this:
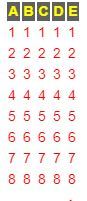
Let's try to add more changes and see the output.
Output:
👁 Image
We can also hide the index column by
hide_index() method:
Output:
👁 Image