 |
VOOZH | about |
|
VOOZH | about |
Analyzing the selling price of used cars is essential for making informed decisions in the automotive market. Using Python, we can efficiently process and visualize data to uncover key factors influencing car prices. This analysis not only aids buyers and sellers but also enables predictive modeling for future price estimation. This article will explore how to analyze the selling price of used cars using Python.
The dataset contains various attributes of used cars, including price, brand, color, horsepower and more. Our goal is to analyze these factors and determine their impact on selling price. To download the file used in this example, click here.
Problem Statement: Our friend Otis wants to sell his car but isn't sure about the price. He wants to maximize profit while ensuring a reasonable deal for buyers. To help Otis we will analyze the dataset and determine the factors affecting car prices.
.data File to .csvIf the dataset is in .data format, follow these steps to convert it to .csv:
.csv.Now we can proceed with loading the dataset into Python.
To analyze the data install the following Python libraries using the command below:
pip install pandas numpy matplotlib seaborn scipy
Import the following python libraries: numpy, pandas, matplotlib, seaborn and scipy.
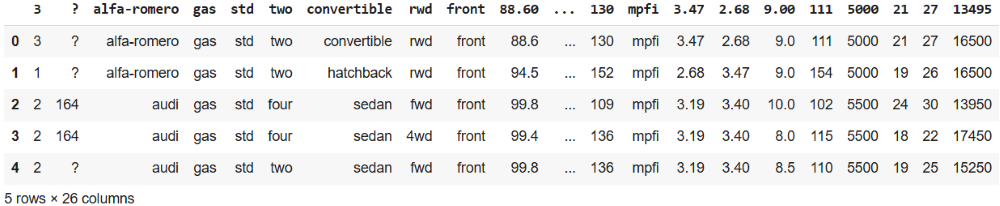
Now, we load the dataset into a Pandas DataFrame and preview the first few rows. Let's check the first five entries of dataset.
Output:
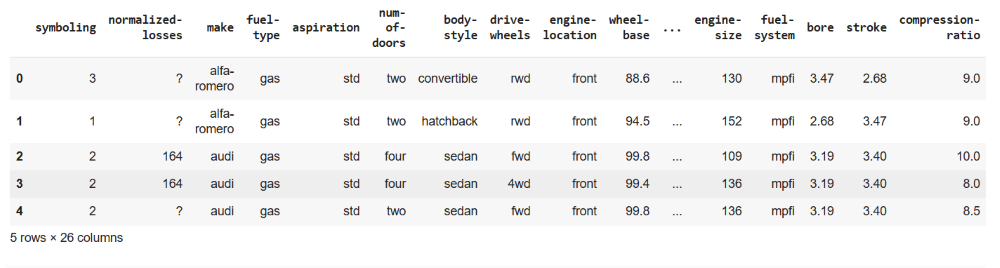
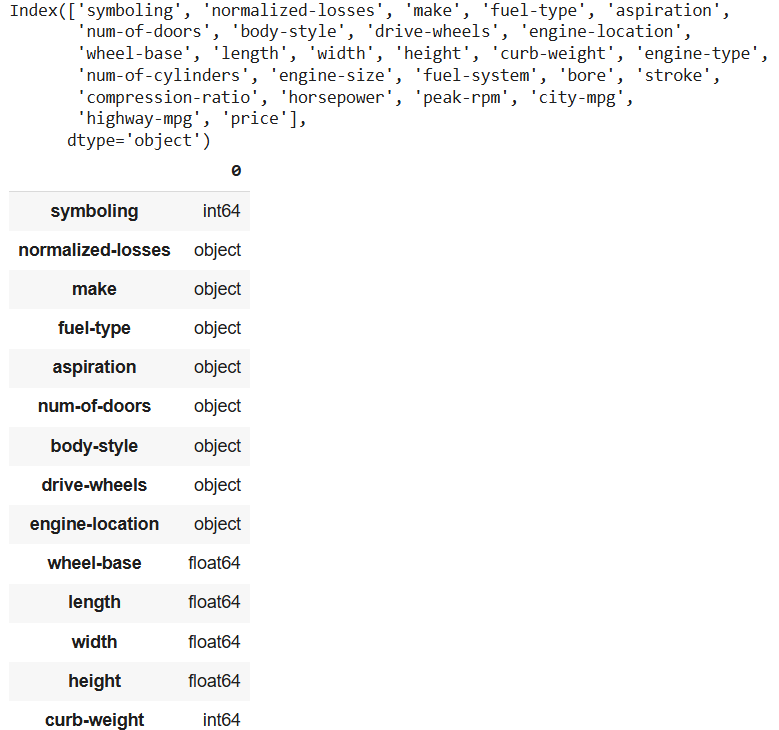
To make our dataset more readable we assign column headers:
Output:
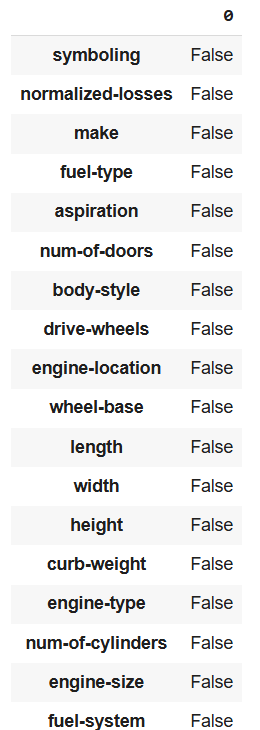
Missing values can impact our analysis. Let's check if any columns contain missing values.
Output:
Since fuel consumption is measured differently in different regions, we convert miles per gallon (MPG) to liters per 100 kilometers (L/100km)
Output:
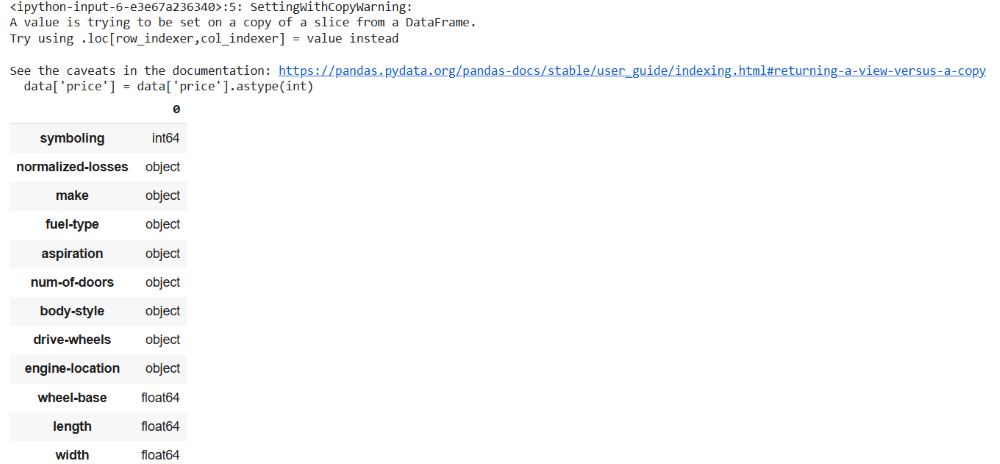
The price column should be numerical, but it may contain string values like ?. We need to clean and convert it:
Output:
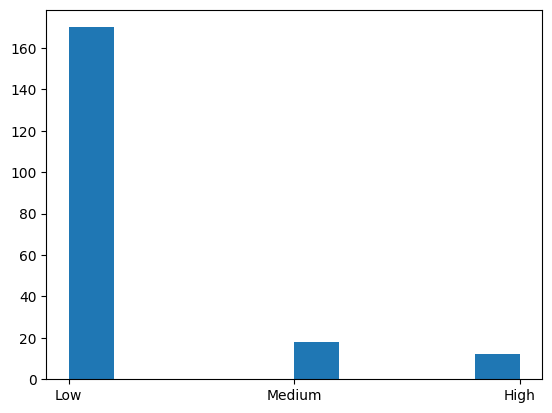
To ensure fair comparisons between different features, we normalize numerical columns. To categorize cars based on their price we divide the price range into three categories: Low, Medium and High.
Output:
Machine learning models require numerical data. We convert categorical variables into numerical ones using one-hot encoding:
Output:
Output:
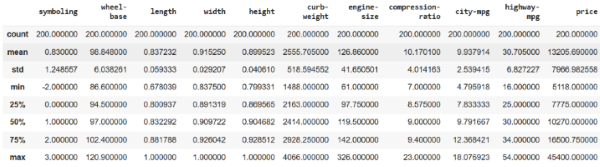
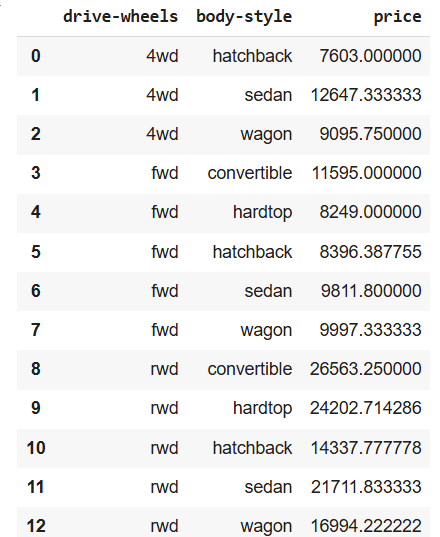
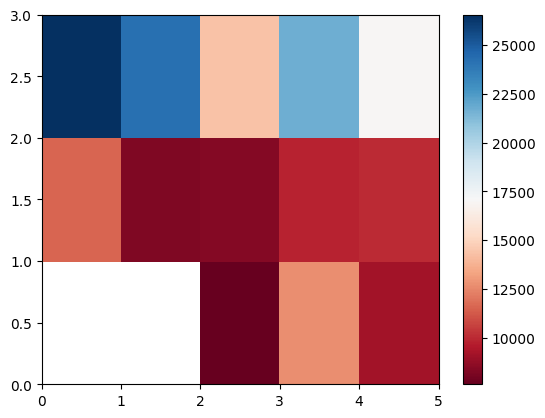
Grouping data helps identify trends based on key variables:
Output:
Output:
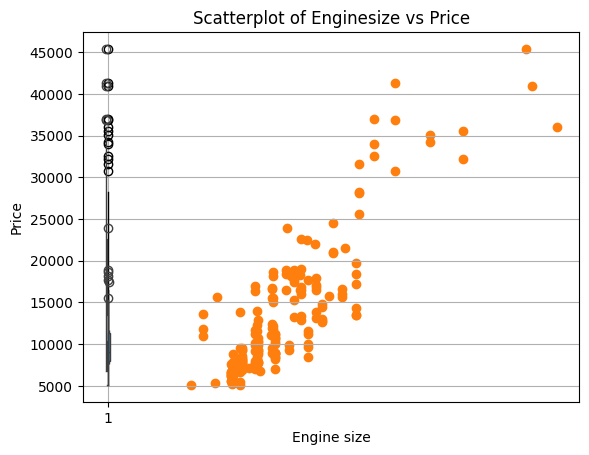
The Analysis of Variance (ANOVA) test helps determine if different groups have significantly different means.
Output:
This step-by-step analysis helps in understanding the key factors influencing the selling price of used cars. Proper data cleaning, visualization and statistical tests ensure that our findings are accurate and insightful.