 |
VOOZH | about |
|
VOOZH | about |
Python is a great language for doing data analysis, primarily because of the fantastic ecosystem of data-centric python packages.
Pandas is one of those packages and makes importing and analyzing data much easier.
Pandas dataframe.mad() function return the mean absolute deviation of the values for the requested axis. The mean absolute deviation of a dataset is the average distance between each data point and the mean. It gives us an idea about the variability in a dataset.
Syntax: DataFrame.mad(axis=None, skipna=None, level=None) Parameters : axis : {index (0), columns (1)} skipna : Exclude NA/null values when computing the result level : If the axis is a MultiIndex (hierarchical), count along a particular level, collapsing into a Series numeric_only : Include only float, int, boolean columns. If None, will attempt to use everything, then use only numeric data. Not implemented for Series. Returns : mad : Series or DataFrame (if level specified)
Note: This method was removed in pandas version 1.0.0 and later.
Example #1: Use mad() function to find the mean absolute deviation of the values over the index axis.
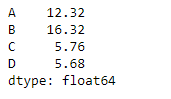
Let’s use the dataframe.mad() function to find the mean absolute deviation.
Output :
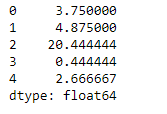
👁 ImageExample #2: Use mad() function to find the mean absolute deviation of values over the column axis which is having some Na values in it.
Output :
👁 Image