 |
VOOZH | about |
|
VOOZH | about |
Java Heap dump is a snapshot of all java objects that are present in the JVM(Java Virtual Machine) at a certain point in time. The JVM allocates memory for objects which are class instances or arrays in the heap memory. When the objects are no longer needed or are no more referenced, the Garbage Collector runs and reclaims the memory space occupied by these objects.
The heap dump is in binary format, and it has .hprof extension. It can be opened and analyzed using applications like JVisualVM and Eclipse MAT(Memory Analyzer Tool). We generate java memory heap dump to identify issues like memory leaks and to optimize memory usage in our application.
There are different ways of generating java memory heap dump. JDK comes up with various tools for generating heap dump. These tools are located in bin folder under JDK home directory.. Let us discuss how to generate JVM Heap Dump which is as follows:
Method 1: Using map command
jmap is a command which you run inside the bin folder of your JDK home directory. It gives statistics about memory usage. The structure is as follows:
Example
jmap -dump:[live],format=b,file=<file-path> <pid>

live:- This parameter is optional. If set, it prints all those objects that
have active references.

format = b , which means the heap dump file is in binary format. It is not necessary
to set this parameter.

file =<file-path> indicates where the heap dump file will be generated.

<pid> :- process id of the java process
👁 Image
Now in order to get the process id of a running java process, one can use one of the below options as defined:
1.1
jps
We type this command from a Unix terminal or Windows Command prompt where JDK is installed. It gives the process ID of the running java process
1.2
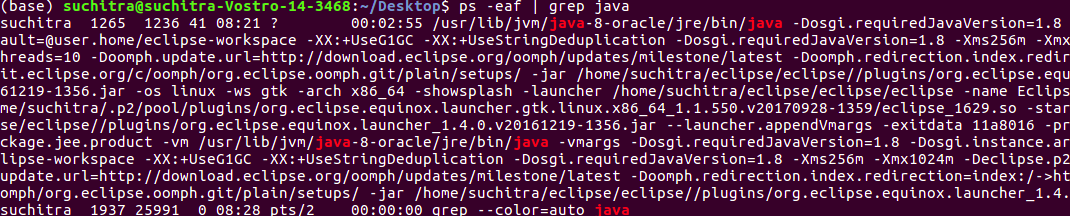
ps -eaf| grep java
This gives the process ID of all running java processes. It works only on a Unix Terminal
1.3 Using task manager application in windows operating systems.
Method 2: Using jcmd command on terminal
This command sends a request to the JVM to generate a heap dump. One of its parameters is GC.heap_dump. It is as shown below:
jcmd <pid> GC.heap_dump <file-path>
<pid> - Process id of java process
<file-path> - Path where the heap dump is to be generated
Method 3: Using the JVisualVM tool
This is a tool that is packaged within JDK. It helps to monitor and troubleshoot java applications. It has a Graphical User Interface that is simple and intuitive. We type jvisualvm in the start menu, or we go to the bin directory of JDK home directory through command prompt or terminal window in Unix and type jvisualvm
It launches a Java Visual VM application. On the left side, it shows the currently running java process. Right-click the process ID whose heap dump you wish to generate. When we click on heap dump, it generates heap dump for the selected process. Under Basic info, it shows the file path where the heap dump is generated.
👁 ImageMethod 4: Identifying HeapDumpOnOutOfMemory
It is ideal to capture heap dumps when an application experiences java.lang.OutOfMemoryError. Heap dumps help identify live objects sitting in the memory and the percentage of memory it occupies.
-XX:+HeapDumpOnOutOfMemoryError -XX:HeapDumpPath=<file-path>
While running your java application when this system property is set, JVM takes a snapshot of the heap dump when it encounters OutOfMemoryError.
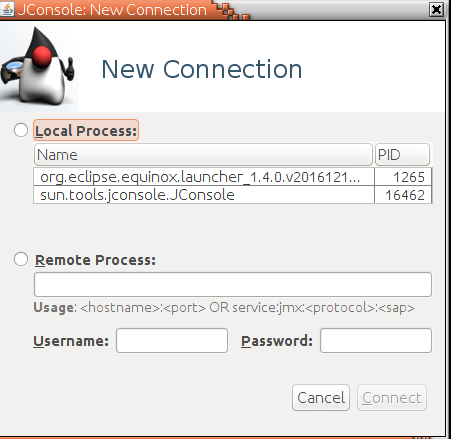
Method 5:Using JMX Console
There is a Hotspot Diagnostic MBean which has a heap dump operation. We use jmx clients like jconsole to invoke the MBean operation. Through JConsole, we can either connect to a local java process or a remote process by specifying the host and port number and username/password. Once we connect to the process id, jconsole applications open with multiple tabs. The Overview tab shows Heap Memory usage, threads, classes, CPU usage
Method 6: Using HotSpotDiagnosticMBean by writing a program
We use HotSpotDiagnosticMBean to invoke the heap dump operation. We get the MBean object from the MBean platform server. In the below example, we have used reflection to invoke the heapDump() method of the MBean object.
Example
Note:
We run this application by passing command-line arguments for file path where the heap dump is to be generated and live parameter which can be set as true or false. When this java code is run, it generates a heap1.hprof file in src folder. This heap dump can be analyzed using MAT(Memory Analyzer Tool). This can be installed as a plugin in Eclipse from Marketplace.