 |
VOOZH | about |
|
VOOZH | about |
Average Costs are the per unit costs which explain the relationship between the cost and output in a realistic manner. These per-unit costs are obtained from Total Fixed Cost, Total Variable Cost, and Total Cost. The three different types of per-unit costs are as follows:
The per unit fixed cost of production is known as Average Fixed Cost. The formula for calculating Average Fixed Cost is:
With an increase in the output, Average Fixed Cost falls. It is because the total fixed cost remains the same at all output levels.
Example:
It can be seen in the above schedule that with the increase in output level, AFC falls. It is because the constant TFC; i.e., ₹10 is divided by the increasing output.
In the above graph, the AFC curve is formed by plotting the points shown in the above schedule. AFC will keep on falling because of the increasing output level; however, it can never be equal to zero. Therefore, the AFC curve is a rectangular hyperbola. It means that AFC is a curve in which any rectangle formed under the curve will have the same area.
AFC curve does not touches X-axis and Y-axis.
AFC is a rectangular hyperbola and hence approaches both the axes. The curve gets near to the axes, but never touches them. It means that AFC can neither touch X-axis (because TFC can never be zero) nor Y-axis (because TFC is positive at zero output level and if we divide any value by zero, it will be an infinite value).
The per unit variable cost of production is known as Average Variable Cost. The formula for calculating Average Variable Cost is:
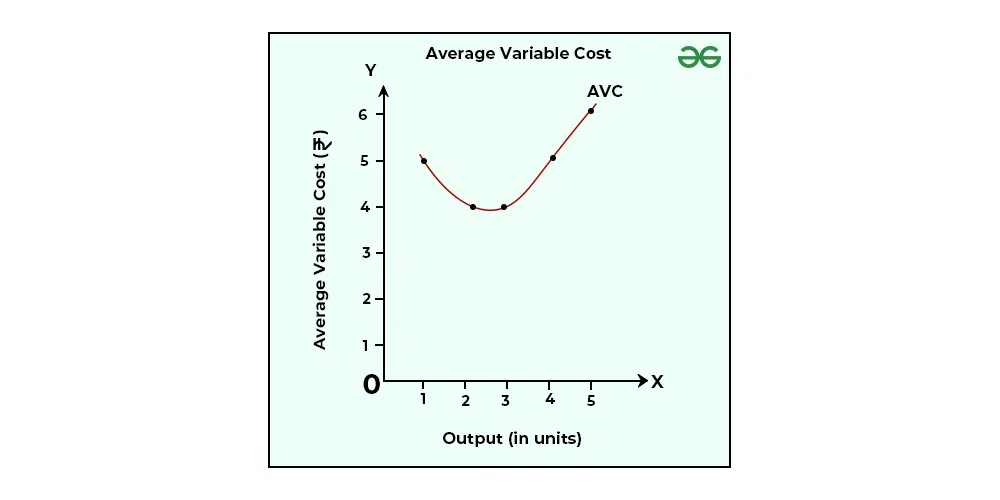
Initially, Average Variable Cost falls with an increase in output. Once the output increases till the optimum level, the average variable cost starts to rise.
Example:
It can be seen in the above schedule that initially, AVC falls with an increase in output level, and once it reaches its minimum level: i.e., ₹4, it starts to rise.
In the above graph, the AVC curve is obtained by plotting the points shown in the above schedule. AVC curve is a U-shaped curve because of the Law of Variable Proportion. In the beginning, the AVC curve falls (because of the increasing returns to a factor with better utilisation of fixed factors and variable factors), and after reaching its minimum level; i.e., optimum output level, it starts on increasing with every additional output (because of diminishing returns to factor).
The per unit total cost of production is known as Average Total Cost or Average Cost. The formula for calculating Average Total Cost is:
Another way to define Average Total Cost is by the sum of Average Fixed Cost and Average Variable Cost; i.e., AC = AFC + AVC.
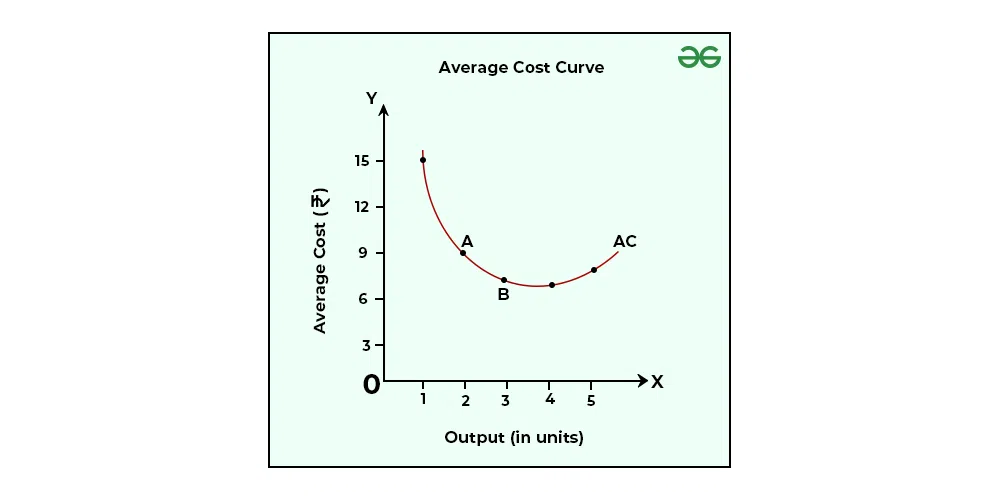
Just like Average Variable Cost, average cost also initially falls with an increase in output. Once the output increases till the optimum level, the average cost starts to rise.
Example:
In the above schedule, AC is determined by adding AFC and AVC.
In the above graph, the AC curve is a U-shaped curve, which means that initially, AC falls (Phase 1), and after reaching its minimum point (Phase 2), it starts to rise (Phase 3).
Phase 1: When AFC and AVC both fall (till 2 output level), AC also falls (till point A).
Phase 2: From 2 units of output to 3 units of output, AFC continues to fall; however, AVC remains the same; i.e., ₹4, and because of this AC falls till it reaches its minimum point (Point B). From 3 units of output to 4 units of output, the fall in AFC is equal (approx) to the rise in AVC; therefore, AC remains the same.
Phase 3: Now, after 4 units of output, the rise in AVC; i.e., by ₹1 is more than the fall in AFC; i.e., ₹0.5; therefore, AC starts to rise.
.webp)
.webp)