 |
VOOZH | about |
|
VOOZH | about |
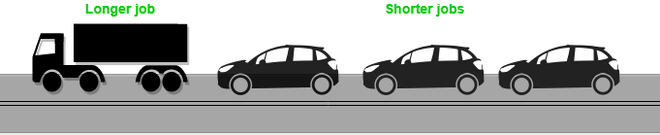
The Convoy Effect is a phenomenon associated with the First Come First Serve (FCFS) algorithm, in which the whole Operating System slows down due to a few slow processes.
FCFS algorithm is non-preemptive in nature, that is, once CPU time has been allocated to a process, other processes can get CPU time only after the current process has finished. This property of FCFS scheduling leads to the situation called Convoy Effect. Suppose there is one CPU-intensive (large burst time) process in the ready queue, and several other processes with relatively fewer burst times but are Input/Output (I/O) bound (Need I/O operations frequently).
Steps are as following below:
Hence in Convoy Effect, one slow process slows down the performance of the entire set of processes, and leads to wastage of CPU time and other devices. To avoid Convoy Effect, preemptive scheduling algorithms like Round Robin Scheduling can be used - as the smaller processes don't have to wait much for CPU time - making their execution faster and leading to less resources sitting idle.
Consider there are three processes, P1, P2, and P3. The burst time of process P3 is the highest.
The following formulas in the table are used to compute the waiting time and turnaround time:
Waiting Time = Turn Around Time - Burst Time
Turn Around Time = Completion Time - Arrival Time
Process P3 is the first in the queue in the first scenario, yet it has the longest burst time of all the processes. Because we are using the FCFS scheduling technique, Process P3 will be carried out by the CPU first.
The CPU's average waiting time will be rather long according to this schedule. The convoy effect is the cause of this. P1 and P2, the other processes, will have to wait 46 units of time for their turn. Whatever the case their burst time is very low. Now this schedule suffers from starvation.
Process ID | Arrival Time | Brust Time | Completion Time | Turn Around Time | Waiting Time |
|---|---|---|---|---|---|
P1 |
1 |
1 |
42 |
41 |
40 |
P2 |
1 |
3 |
45 |
44 |
41 |
P3 |
0 |
42 |
46 |
46 |
4 |
Avg waiting Time of processes = 85/3.
In the second example, the starving issue would not have arisen if Process P1 had arrived at the end of the queue and the other processes P2 and P3 had finished before then.
Let's look at one more example to see how the waiting periods in the two circumstances differ from one another. Even though the schedule has the same length (45 units), there will be less waiting time with this one.
Process ID | Arrival Time | Brust Time | Completion Time | Turn Around Time | Waiting Time |
|---|---|---|---|---|---|
P1 |
0 |
2 |
4 |
2 |
0 |
P2 |
0 |
1 |
3 |
3 |
2 |
P3 |
1 |
42 |
45 |
44 |
2 |
Avg Waiting Time = 4/3