 |
VOOZH | about |
|
VOOZH | about |
Prerequisite:
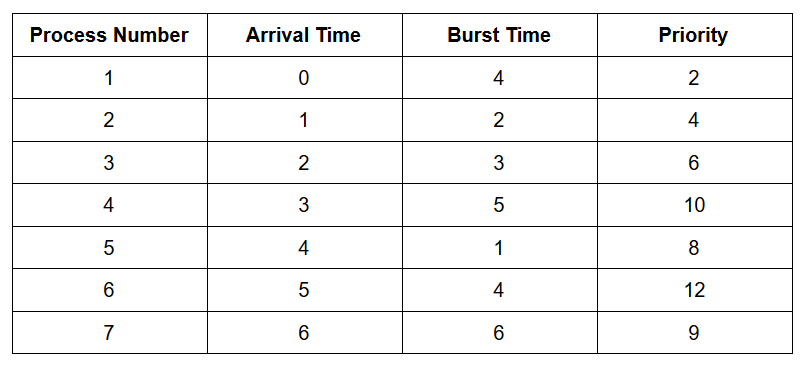
CPU Scheduling in Operating SystemsDifferent Scheduling Algorithms:
Consider the following table:
👁 ImageBelow is the implementation of the above algorithms using a
priority queue:
OUTPUT :-
+-------------+--------------+------------+-----------------+-----------------+--------------+---------------+
| Process No. | Arrival Time | Burst Time | Completion Time | Turnaround Time | Waiting Time | Response Time |
+-------------+--------------+------------+-----------------+-----------------+--------------+---------------+
| 1 | 0 | 4 | 4 | 4 | 0 | 0 |
| 2 | 1 | 2 | 6 | 5 | 3 | 3 |
| 3 | 2 | 3 | 9 | 7 | 4 | 4 |
| 4 | 3 | 5 | 14 | 11 | 6 | 6 |
| 5 | 4 | 1 | 15 | 11 | 10 | 10 |
| 6 | 5 | 4 | 19 | 14 | 10 | 10 |
| 7 | 6 | 6 | 25 | 19 | 13 | 13 |
+-------------+--------------+------------+-----------------+-----------------+--------------+---------------+

Total completion time :- 92
Average completion time :- 13.1429

Total turnaround time :- 71
Average turnaround time :- 10.1429

Total waiting time :- 46
Average waiting time :- 6.57143

Total response time :- 46
Average response time :- 6.57143


Gantt Chart (IS indicates ideal state) :-

+----------+------+--------+------------+----+----------+--------------+
| P1 | P2 | P3 | P4 | P5 | P6 | P7 |
+----------+------+--------+------------+----+----------+--------------+
0 4 6 9 14 15 19 25
OUTPUT :-
+-------------+--------------+------------+-----------------+-----------------+--------------+---------------+
| Process No. | Arrival Time | Burst Time | Completion Time | Turnaround Time | Waiting Time | Response Time |
+-------------+--------------+------------+-----------------+-----------------+--------------+---------------+
| 1 | 0 | 4 | 7 | 7 | 3 | 0 |
| 2 | 1 | 2 | 3 | 2 | 0 | 0 |
| 3 | 2 | 3 | 10 | 8 | 5 | 5 |
| 4 | 3 | 5 | 19 | 16 | 11 | 11 |
| 5 | 4 | 1 | 5 | 1 | 0 | 0 |
| 6 | 5 | 4 | 14 | 9 | 5 | 5 |
| 7 | 6 | 6 | 25 | 19 | 13 | 13 |
+-------------+--------------+------------+-----------------+-----------------+--------------+---------------+

Total completion time :- 83
Average completion time :- 11.8571

Total turnaround time :- 62
Average turnaround time :- 8.85714

Total waiting time :- 37
Average waiting time :- 5.28571

Total response time :- 34
Average response time :- 4.85714


Gantt Chart (IS indicates ideal state) :-

+----+------+----+----+------+--------+----------+------------+--------------+
| P1 | P2 | P1 | P5 | P1 | P3 | P6 | P4 | P7 |
+----+------+----+----+------+--------+----------+------------+--------------+
0 1 3 4 5 7 10 14 19 25
OUTPUT :-
+-------------+--------------+------------+-----------------+-----------------+--------------+---------------+
| Process No. | Arrival Time | Burst Time | Completion Time | Turnaround Time | Waiting Time | Response Time |
+-------------+--------------+------------+-----------------+-----------------+--------------+---------------+
| 1 | 0 | 4 | 4 | 4 | 0 | 0 |
| 2 | 1 | 2 | 7 | 6 | 4 | 4 |
| 3 | 2 | 3 | 10 | 8 | 5 | 5 |
| 4 | 3 | 5 | 19 | 16 | 11 | 11 |
| 5 | 4 | 1 | 5 | 1 | 0 | 0 |
| 6 | 5 | 4 | 14 | 9 | 5 | 5 |
| 7 | 6 | 6 | 25 | 19 | 13 | 13 |
+-------------+--------------+------------+-----------------+-----------------+--------------+---------------+

Total completion time :- 84
Average completion time :- 12

Total turnaround time :- 63
Average turnaround time :- 9

Total waiting time :- 38
Average waiting time :- 5.42857

Total response time :- 38
Average response time :- 5.42857


Gantt Chart (IS indicates ideal state) :-

+----------+----+------+--------+----------+------------+--------------+
| P1 | P5 | P2 | P3 | P6 | P4 | P7 |
+----------+----+------+--------+----------+------------+--------------+
0 4 5 7 10 14 19 25
OUTPUT :-
+-------------+--------------+------------+-----------------+-----------------+--------------+---------------+
| Process No. | Arrival Time | Burst Time | Completion Time | Turnaround Time | Waiting Time | Response Time |
+-------------+--------------+------------+-----------------+-----------------+--------------+---------------+
| 1 | 0 | 4 | 23 | 23 | 19 | 0 |
| 2 | 1 | 2 | 22 | 21 | 19 | 12 |
| 3 | 2 | 3 | 24 | 22 | 19 | 0 |
| 4 | 3 | 5 | 19 | 16 | 11 | 0 |
| 5 | 4 | 1 | 20 | 16 | 15 | 15 |
| 6 | 5 | 4 | 21 | 16 | 12 | 0 |
| 7 | 6 | 6 | 25 | 19 | 13 | 0 |
+-------------+--------------+------------+-----------------+-----------------+--------------+---------------+

Total completion time :- 154
Average completion time :- 22

Total turnaround time :- 133
Average turnaround time :- 19

Total waiting time :- 108
Average waiting time :- 15.4286

Total response time :- 27
Average response time :- 3.85714


Gantt Chart (IS indicates ideal state) :-

+------+----+------+----+----------+----+------+----+----+----+----+------+----+----+----+----+----+----+
| P1 | P3 | P4 | P6 | P7 | P4 | P6 | P2 | P1 | P3 | P7 | P4 | P5 | P6 | P2 | P1 | P3 | P7 |
+------+----+------+----+----------+----+------+----+----+----+----+------+----+----+----+----+----+----+
0 2 3 5 6 10 11 13 14 15 16 17 19 20 21 22 23 24 25
OUTPUT :-
+-------------+--------------+------------+-----------------+-----------------+--------------+---------------+
| Process No. | Arrival Time | Burst Time | Completion Time | Turnaround Time | Waiting Time | Response Time |
+-------------+--------------+------------+-----------------+-----------------+--------------+---------------+
| 1 | 0 | 4 | 4 | 4 | 0 | 0 |
| 2 | 1 | 2 | 24 | 23 | 21 | 21 |
| 3 | 2 | 3 | 22 | 20 | 17 | 17 |
| 4 | 3 | 5 | 9 | 6 | 1 | 1 |
| 5 | 4 | 1 | 25 | 21 | 20 | 20 |
| 6 | 5 | 4 | 19 | 14 | 10 | 10 |
| 7 | 6 | 6 | 15 | 9 | 3 | 3 |
+-------------+--------------+------------+-----------------+-----------------+--------------+---------------+

Total completion time :- 118
Average completion time :- 16.8571

Total turnaround time :- 97
Average turnaround time :- 13.8571

Total waiting time :- 72
Average waiting time :- 10.2857

Total response time :- 72
Average response time :- 10.2857


Gantt Chart (IS indicates ideal state) :-

+----------+------------+--------------+----------+--------+------+----+
| P1 | P4 | P7 | P6 | P3 | P2 | P5 |
+----------+------------+--------------+----------+--------+------+----+
0 4 9 15 19 22 24 25
OUTPUT :-
+-------------+--------------+------------+-----------------+-----------------+--------------+---------------+
| Process No. | Arrival Time | Burst Time | Completion Time | Turnaround Time | Waiting Time | Response Time |
+-------------+--------------+------------+-----------------+-----------------+--------------+---------------+
| 1 | 0 | 4 | 8 | 8 | 4 | 0 |
| 2 | 1 | 2 | 4 | 3 | 1 | 1 |
| 3 | 2 | 3 | 16 | 14 | 11 | 2 |
| 4 | 3 | 5 | 23 | 20 | 15 | 5 |
| 5 | 4 | 1 | 11 | 7 | 6 | 6 |
| 6 | 5 | 4 | 20 | 15 | 11 | 6 |
| 7 | 6 | 6 | 25 | 19 | 13 | 7 |
+-------------+--------------+------------+-----------------+-----------------+--------------+---------------+

Total completion time :- 107
Average completion time :- 15.2857

Total turnaround time :- 86
Average turnaround time :- 12.2857

Total waiting time :- 61
Average waiting time :- 8.71429

Total response time :- 27
Average response time :- 3.85714

Time Quantum for round robin :- 2


Gantt Chart (IS indicates ideal state) :-

+------+------+------+------+------+----+------+------+----+------+------+------+----+------+
| P1 | P2 | P3 | P1 | P4 | P5 | P6 | P7 | P3 | P4 | P6 | P7 | P4 | P7 |
+------+------+------+------+------+----+------+------+----+------+------+------+----+------+
0 2 4 6 8 10 11 13 15 16 18 20 22 23 25
OUTPUT :-
+-------------+--------------+------------+-----------------+-----------------+--------------+---------------+----------+
| Process No. | Arrival Time | Burst Time | Completion Time | Turnaround Time | Waiting Time | Response Time | Priority |
+-------------+--------------+------------+-----------------+-----------------+--------------+---------------+----------+
| 1 | 0 | 4 | 25 | 25 | 21 | 0 | 2 |
| 2 | 1 | 2 | 22 | 21 | 19 | 0 | 4 |
| 3 | 2 | 3 | 21 | 19 | 16 | 0 | 6 |
| 4 | 3 | 5 | 12 | 9 | 4 | 0 | 10 |
| 5 | 4 | 1 | 19 | 15 | 14 | 14 | 8 |
| 6 | 5 | 4 | 9 | 4 | 0 | 0 | 12 |
| 7 | 6 | 6 | 18 | 12 | 6 | 6 | 9 |
+-------------+--------------+------------+-----------------+-----------------+--------------+---------------+----------+

Total completion time :- 126
Average completion time :- 18

Total turnaround time :- 105
Average turnaround time :- 15

Total waiting time :- 80
Average waiting time :- 11.4286

Total response time :- 20
Average response time :- 2.85714


Gantt Chart (IS indicates ideal state) :-

+----+----+----+------+----------+--------+--------------+----+------+----+--------+
| P1 | P2 | P3 | P4 | P6 | P4 | P7 | P5 | P3 | P2 | P1 |
+----+----+----+------+----------+--------+--------------+----+------+----+--------+
0 1 2 3 5 9 12 18 19 21 22 25
OUTPUT :-
+-------------+--------------+------------+-----------------+-----------------+--------------+---------------+----------+
| Process No. | Arrival Time | Burst Time | Completion Time | Turnaround Time | Waiting Time | Response Time | Priority |
+-------------+--------------+------------+-----------------+-----------------+--------------+---------------+----------+
| 1 | 0 | 4 | 4 | 4 | 0 | 0 | 2 |
| 2 | 1 | 2 | 25 | 24 | 22 | 22 | 4 |
| 3 | 2 | 3 | 23 | 21 | 18 | 18 | 6 |
| 4 | 3 | 5 | 9 | 6 | 1 | 1 | 10 |
| 5 | 4 | 1 | 20 | 16 | 15 | 15 | 8 |
| 6 | 5 | 4 | 13 | 8 | 4 | 4 | 12 |
| 7 | 6 | 6 | 19 | 13 | 7 | 7 | 9 |
+-------------+--------------+------------+-----------------+-----------------+--------------+---------------+----------+

Total completion time :- 113
Average completion time :- 16.1429

Total turnaround time :- 92
Average turnaround time :- 13.1429

Total waiting time :- 67
Average waiting time :- 9.57143

Total response time :- 67
Average response time :- 9.57143


Gantt Chart (IS indicates ideal state) :-

+----------+------------+----------+--------------+----+--------+------+
| P1 | P4 | P6 | P7 | P5 | P3 | P2 |
+----------+------------+----------+--------------+----+--------+------+
0 4 9 13 19 20 23 25
OUTPUT :-
+-------------+--------------+------------+-----------------+-----------------+--------------+---------------+
| Process No. | Arrival Time | Burst Time | Completion Time | Turnaround Time | Waiting Time | Response Time |
+-------------+--------------+------------+-----------------+-----------------+--------------+---------------+
| 1 | 0 | 4 | 4 | 4 | 0 | 0 |
| 2 | 1 | 2 | 6 | 5 | 3 | 3 |
| 3 | 2 | 3 | 10 | 8 | 5 | 5 |
| 4 | 3 | 5 | 15 | 12 | 7 | 7 |
| 5 | 4 | 1 | 7 | 3 | 2 | 2 |
| 6 | 5 | 4 | 19 | 14 | 10 | 10 |
| 7 | 6 | 6 | 25 | 19 | 13 | 13 |
+-------------+--------------+------------+-----------------+-----------------+--------------+---------------+

Total completion time :- 86
Average completion time :- 12.2857

Total turnaround time :- 65
Average turnaround time :- 9.28571

Total waiting time :- 40
Average waiting time :- 5.71429

Total response time :- 40
Average response time :- 5.71429


Gantt Chart (IS indicates ideal state) :-

+----------+------+----+--------+------------+----------+--------------+
| P1 | P2 | P5 | P3 | P4 | P6 | P7 |
+----------+------+----+--------+------------+----------+--------------+
0 4 6 7 10 15 19 25