 |
VOOZH | about |
|
VOOZH | about |
An architecture diagram is a graphic illustration that is utilized in describing a system, application, or infrastructure's design and layout. The important elements, their connections, interactions, and manner in which these interact with each other in order to create a complete system are identified. The complex ideas are communicated in a simplified form in a manner that is understandable, making these a blueprint that can be shared with stakeholders that include project managers, developers, architects, as well as non-technical stakeholders.
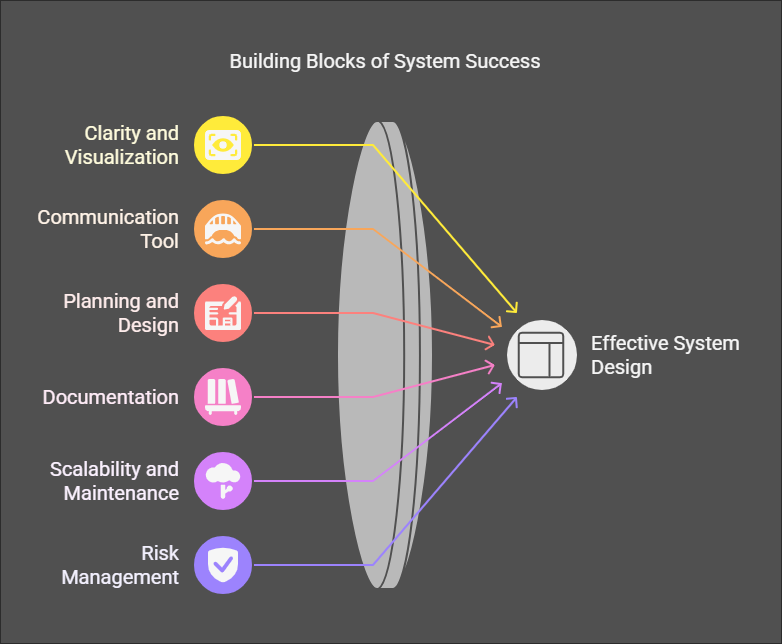
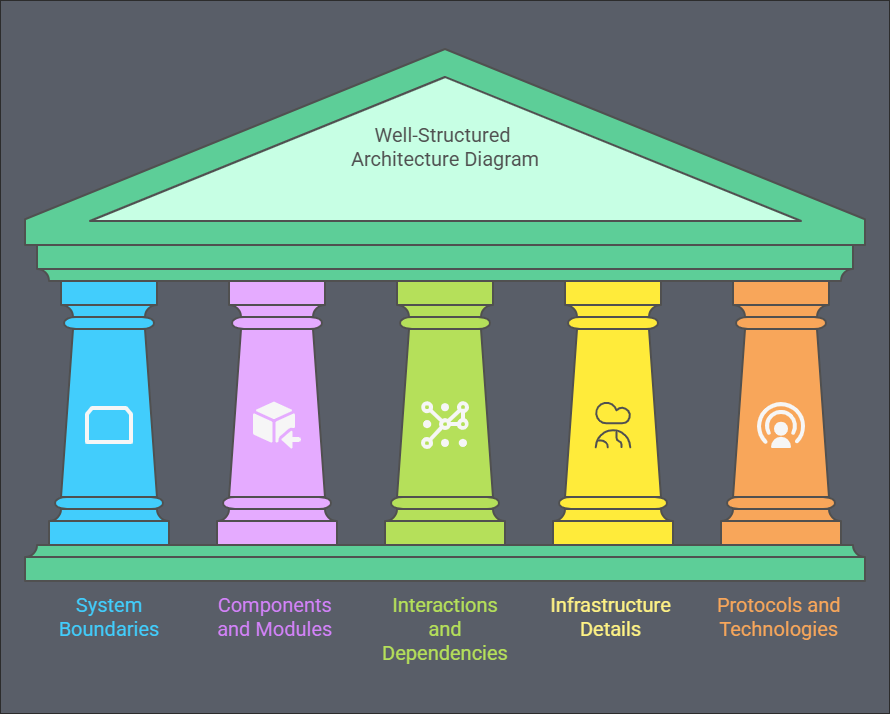
A well-structured architecture diagram should provide a clear, concise, and accurate representation of a system's design. To ensure it effectively communicates the system's structure and behavior, here are the key elements to include:
Whether in software development, building design, or infrastructure planning, these diagrams simplify abstract concepts, align stakeholders, and guide implementation. Let's explore five fundamental types of architectural diagrams, their purposes, and step-by-step instructions to create them effectively.
A Conceptual Architecture Diagram is a high-level visualization that represents a system's overall structure, boundaries, and interactions with external entities. It provides a bird's-eye view, highlighting key components and their interactions, both internally and externally. This diagram answers fundamental questions like "What is the system?" and "Who does it interact with?" by focusing on the system's purpose and connections rather than technical details. It offers a simplified overview of the system's environment, making it easier to understand and communicate complex systems to diverse stakeholders.
Purpose: The main purpose of a Conceptual Architecture Diagram is to help stakeholders—both technical and non-technical—understand the system's overarching structure and its relationship with external entities.
1. Identify the Core System: Start by identifying the core system or application you are building. Represent it with a central shape (e.g., a rectangle or circle) in the diagram. This is the focal point, and all external interactions will be illustrated around this.
2. List External Entities: Surround the core system with boxes or circles representing external entities that interact with the system. These could include:
3. Define Interactions: Use arrows or lines to show how the core system interacts with the external entities. The arrows represent data flow, control flow, or communication between different components. Label the arrows with brief descriptions, like "API requests," "User login," or "Data synchronization."
4. Add Contextual Labels: Briefly annotate the diagram to provide more information about key interactions. For instance, you could label the flow between the system and an external service as "Payment Processing" or "Authentication."
5. Simplify the Diagram: The goal of a conceptual diagram is to be simple and easy to understand. Avoid including unnecessary technical details. Focus on presenting a clear, intuitive picture of the system and its interactions.
For an E-commerce Platform, the conceptual diagram could include the following components:
Core System: The platform itself.
External Entities:
Interactions:
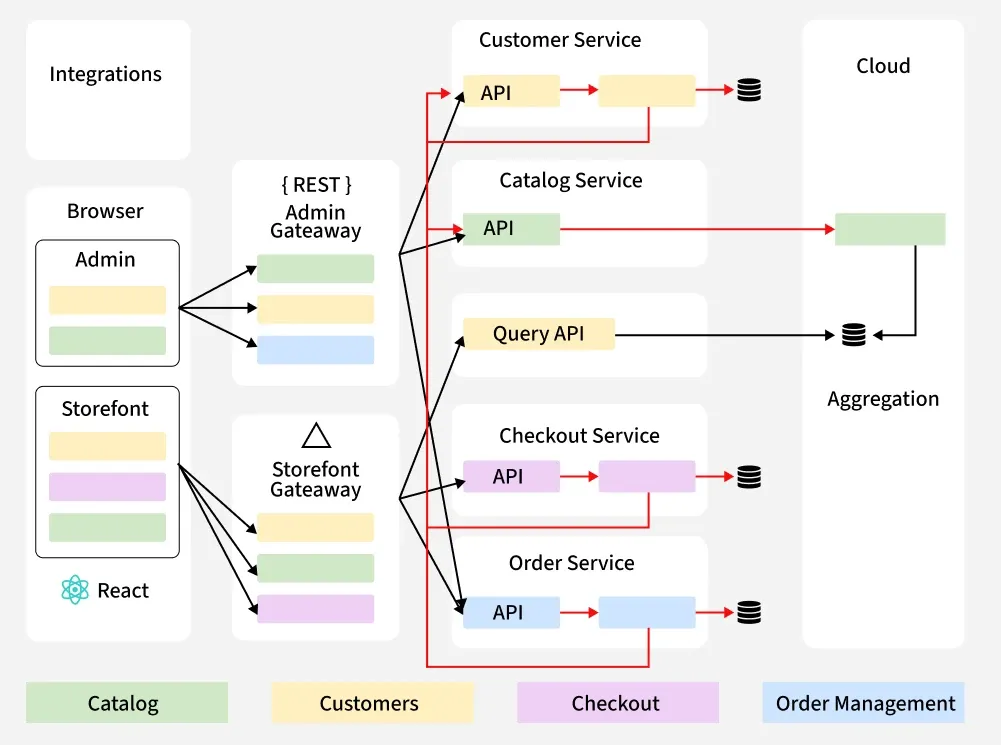
A Component Architecture Diagram provides a detailed view of a software system by breaking it down into individual components or modules. Each component is represented as a distinct unit, showing its internal structure, interfaces, and relationships with other components. This diagram highlights how components communicate and collaborate to achieve the system's overall functionality, focusing on their responsibilities and interactions through well-defined interfaces. Components can range from services and subsystems to libraries and classes.
Purpose: It helps define the specific responsibilities of each component within the system, which is critical in understanding how different parts of the system contribute to the whole. By breaking the system down into components, this diagram serves as a guide for developers. It defines how to implement each component, what APIs or communication protocols should be used, and how components should interact
1. Decompose the System: Start by breaking the system down into smaller, manageable components. For instance, if you’re building an e-commerce platform, you could split it into components like User Authentication, Order Processing, Payment Service, Product Catalog, etc.
Example: In a social media app, components might include User Profile Management, Post Feed, Messaging, and Notification Engine.
2. Define Interfaces: Once the components are defined, specify the interfaces through which they will communicate with each other. These interfaces could be APIs, services, or messaging queues. For example, a "Cart Service" might communicate with a "Payment Service" through a REST API or GraphQL.
Example: A "User Auth" component might expose a REST API that allows the "Order Processing" component to authenticate users during checkout.
3. Map Dependencies: Show how components are dependent on each other. Use arrows to indicate how data or requests flow between components. This helps developers understand how to sequence interactions and ensure that each component communicates as intended.
Example: In an e-commerce platform:
4. Add Details: After mapping the components and their relationships, include further details to make the diagram clearer. These details might include:
Imagine you’re building a Social Media App. A Component Architecture Diagram for such an app might include the following components:
Each component will have its own responsibilities and interfaces, like:
A Deployment Architecture Diagram visualizes how software components are deployed across physical or cloud infrastructure. It shows how components are distributed and run on servers, networks, and cloud services, providing an overview of the system's infrastructure. This diagram maps software components to hardware or cloud resources and illustrates their interactions within the infrastructure. Unlike a Component Architecture Diagram, it focuses on the physical or virtual deployment environment rather than the internal structure of components.
Purpose: The diagram provides insights into how resources (e.g., servers, databases, and storage) are allocated and used. It helps ensure that resources are properly distributed and that the infrastructure can scale to meet demand.A Deployment Architecture Diagram highlights the various components and their connections, making it easier to identify any single points of failure (SPOF).
1. Identify Nodes: The first step is to list all the infrastructure nodes that the software components will be deployed on. These nodes could include servers, databases, cloud services, storage devices, or content delivery networks (CDNs). Each node represents a physical or virtual machine that will host a specific software component.
Example: If you're deploying a web application, nodes might include:
2. Map Components to Nodes: Next, map your software components to the identified nodes. This means showing which components of the application are hosted on which nodes. For example, if your web application is built with Node.js, you would show that the "Node.js app" runs on the AWS EC2 instance.
Example:
3. Add Connections: Once the nodes and components are mapped, draw connections between them to represent how they communicate with each other. These connections could be network links (e.g., HTTP, HTTPS, or VPN) or data pipelines. Indicating the type of communication (e.g., secure HTTPS, REST APIs) is important for understanding how data flows through the system.
Example:
4. Highlight Configurations: Add configuration details to the diagram to provide additional context. This could include:
Imagine you’re deploying a Web Application on AWS. A Deployment Architecture Diagram for this system might look like this:
Nodes:
Connections:
Configurations:
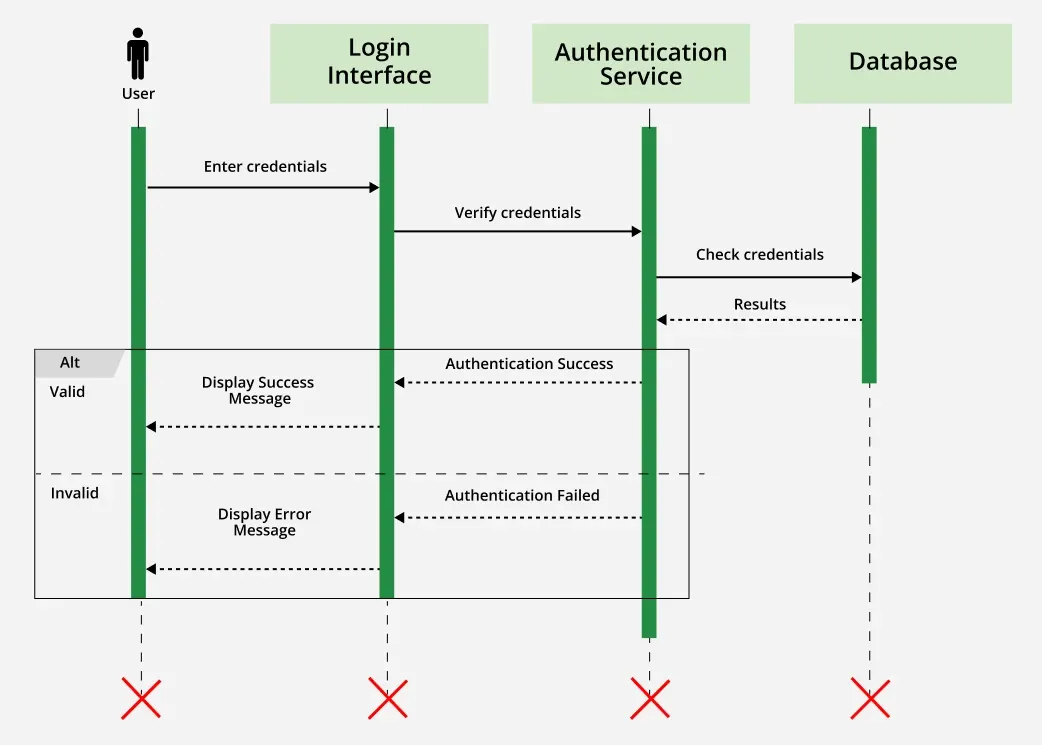
A Sequence Diagram is an interaction diagram that models the dynamic interactions between components or actors over time, focusing on the order of messages exchanged. It illustrates the sequential flow of control or data, showing how objects interact in a given sequence. Unlike structural diagrams like Component Architecture Diagrams, Sequence Diagrams emphasize time-based interactions, making them useful for debugging complex interactions, understanding processes, and modeling business logic.
Purpose: Sequence diagrams model how a particular process or series of actions occurs, emphasizing the order and timing of interactions. In large systems, especially those using microservices or multiple interacting components, debugging complex workflows can be challenging. Sequence diagrams help break down these interactions into understandable steps, making it easier to spot errors, such as missing messages or incorrect data flow.
1. List Actors/Components: The first step in creating a sequence diagram is to identify the participants or actors in the interaction. These could be users, system components, or external services that interact with each other during the process. Each participant is represented by a vertical dashed line, called a "lifeline," which indicates the duration of their involvement in the interaction.
Example:
2. Outline Steps: Define the sequence of actions that take place. This includes all messages, events, or method calls that happen between the participants. The steps are listed in order, from the top (starting the process) to the bottom (completing the process).
Example:
3. Draw Lifelines: Draw vertical dashed lines to represent the lifelines of each participant. The lifeline will start at the top of the diagram and continue to the bottom, indicating the active involvement of each participant in the sequence. The interactions are placed horizontally across these lifelines.
Example:
4. Add Messages: Use horizontal arrows to show the interactions (messages or method calls) between the participants. Each arrow should be labeled with the action being taken. The direction of the arrow shows the flow of the interaction.
Example:
5. Include Timing: The vertical axis of a sequence diagram represents time, with actions progressing from top to bottom. The timing of each message, event, or method call is crucial for understanding how the flow works and identifying any potential delays or errors in the sequence.
Example:
The arrows should show the order of operations, with each interaction happening sequentially from top to bottom. Any delays or parallel operations can be highlighted by indicating branching or asynchronous calls.
Consider a User Login Flow for a web application. The sequence diagram could look like this:
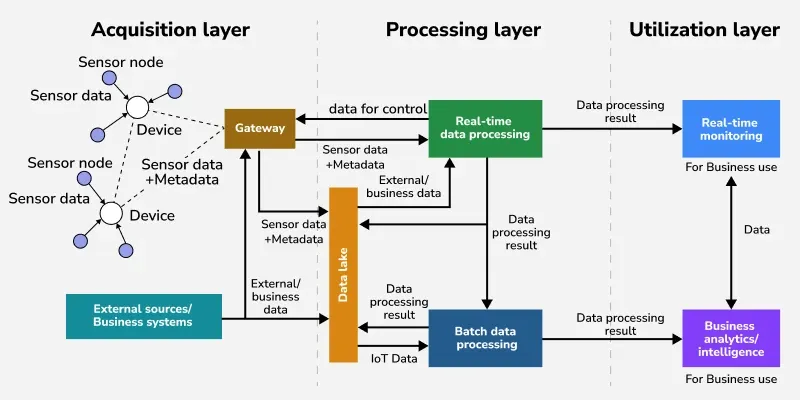
A Data Flow Diagram (DFD) visually represents how data moves through a system, mapping its journey from external entities, through processes that transform it, to data stores where it is stored. DFDs help identify data sources, transformations, and storage locations, providing a clear picture of information flow within a system. Unlike other diagrams that focus on system components or interactions, DFDs emphasize the movement of data, illustrating how inputs are processed into outputs.
Purpose: The DFD provides a comprehensive view of where data comes from (sources), how it is processed (transformations), and where it is stored (data stores). DFDs are useful for ensuring that data is managed according to established governance policies, especially with respect to compliance, security, and privacy.
1. Identify Data Sources/Destinations: Start by identifying the external entities (sources and destinations) that interact with the system. These could include users, systems, or external applications. External entities are represented as rectangles in the diagram.
Example:
2. Define Processes: Label the processes that transform or manipulate data. Each process is represented as a circle or rounded rectangle and usually corresponds to a specific operation or task (e.g., data validation, data processing)
Example:
3. Add Data Stores: Identify where data is stored in the system. These could be databases, data warehouses, or file systems. Data stores are represented as open-ended rectangles in a DFD.
Example:
4. Connect Elements: Draw arrows to show how data flows between entities, processes, and data stores. Each arrow represents the direction of data movement and is labeled with the data format (e.g., JSON, CSV, XML) or type of information being transferred.
Example:
Consider an IoT System that collects sensor data and processes it in the cloud. A DFD for this system might include the following:
External Entities:
Processes:
Data Stores:
Connections:
Here are some popular tools used for drawingarchitectural diagrams:
A cloud-based diagramming tool that allows users to create professional diagrams and flowcharts, including architectural diagrams. Easy-to-use drag-and-drop interface, real-time collaboration, templates for system architecture, and integration with Google Drive, Microsoft Office, and Slack.
Best For: Creating cloud architecture, system design, and network diagrams.
A free, open-source diagramming tool that works in the browser or as a desktop application. It's often used for creating flowcharts, network diagrams, and software architecture. Free to use, integration with Google Drive and GitHub, customizable templates, and an easy-to-use interface.
Best For: Simple to moderately complex architecture diagrams for software systems and networks.
A professional diagramming tool by Microsoft that is widely used for creating various types of diagrams, including system and architecture diagrams. Pre-built templates for architecture diagrams, collaboration features, integration with Microsoft Office, and the ability to create highly detailed diagrams.
Best For: Large enterprises that need detailed, professional-quality diagrams.
A comprehensive software modeling tool that supports various types of diagrams, including architectural diagrams, UML, and flow diagrams. Advanced diagramming capabilities, supports UML, BPMN, SysML, and ERD diagrams, real-time collaboration, and supports software development processes.
Best For: Complex software development projects, especially for UML and system architecture.
A diagramming tool for macOS and iOS, OmniGraffle is known for its intuitive interface and powerful features for creating detailed architectural and network diagrams. Easy-to-use interface, template support, detailed graphic capabilities, and integration with other tools.
Best For: Mac users who need an elegant, feature-rich tool for creating software and infrastructure diagrams.