 |
VOOZH | about |
|
VOOZH | about |
Interaction Overview Diagrams (IODs) in UML (Unified Modeling Language) provide a high-level view of the interactions between various components or objects in a system. They are used to visualize the flow of control and interactions within a system, showing how different parts of the system communicate and collaborate to achieve a specific goal.
Important Topics for the Interaction Overview Diagrams
An Interaction Overview Diagram (IOD) is a type of UML (Unified Modeling Language) diagram that illustrates the flow of interactions between various elements in a system or process. It provides a high-level overview of how interactions occur, including the sequence of actions, decisions, and interactions between different components or objects.
Annotations and explanations from the Interaction Overview UML diagrams feature several fundamental components that help to show control flow and system interactions. Here's a detailed explanation of these notations:
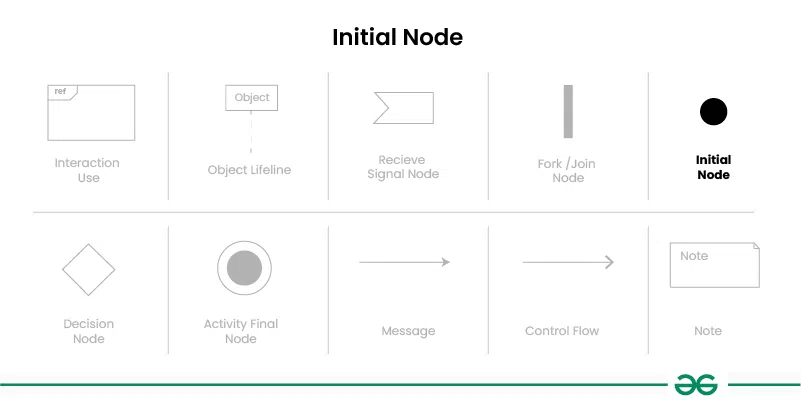
Represents the starting point of the interaction. It is shown as a small solid circle with a single outgoing control flow arrow.
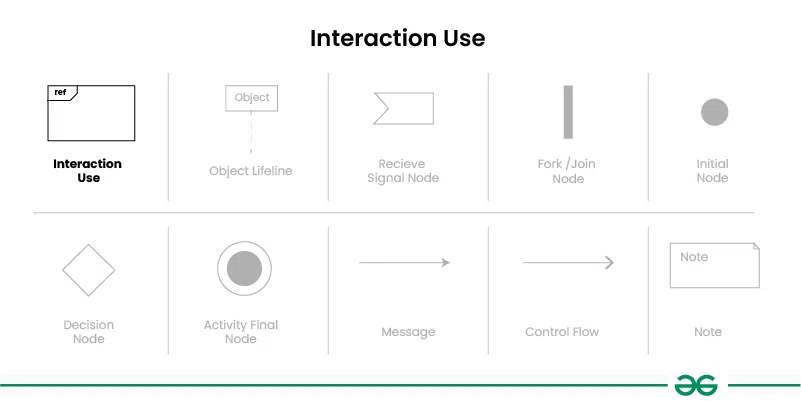
An Interaction Use is used to represent a reference to another interaction or sequence of interactions defined in another diagram or part of the system.An Interaction Use is represented by a rectangular box . Inside the box, you can include a label that specifies the name or reference of the interaction being used.
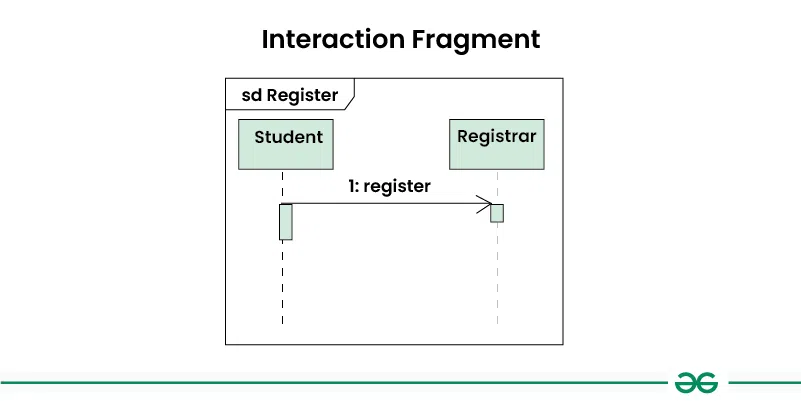
Interaction fragments are used to group and organize interactions within the diagram.
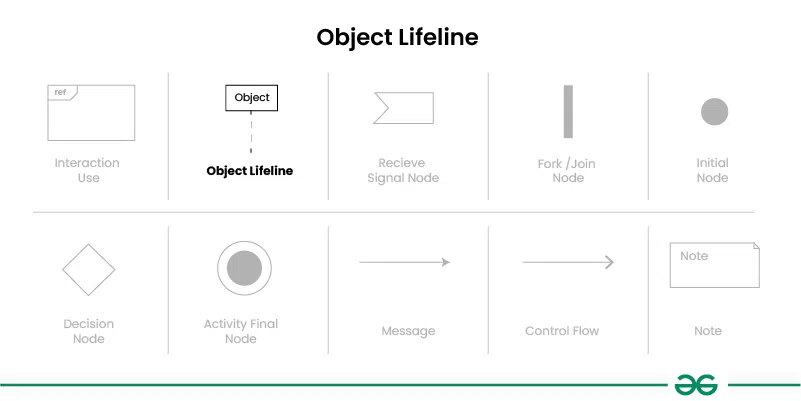
Represents the lifespan of an object during the interaction. It is a vertical dashed line that extends from the top of the diagram to the bottom, with the object's name or class at the top.
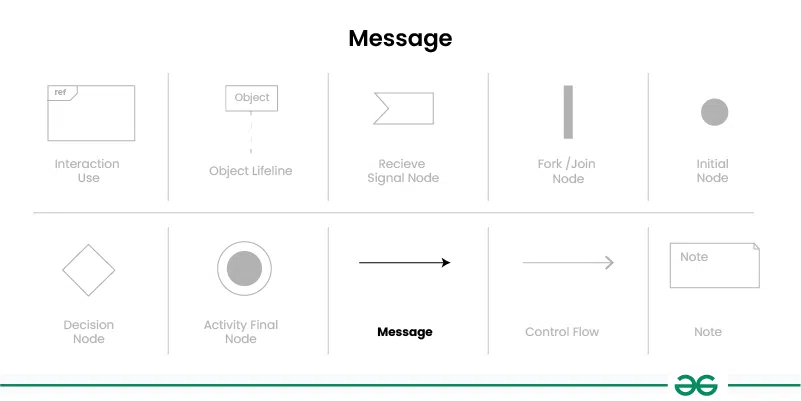
Represents communication between objects or components in the system. Messages are shown as arrows between lifelines, indicating the direction of communication.
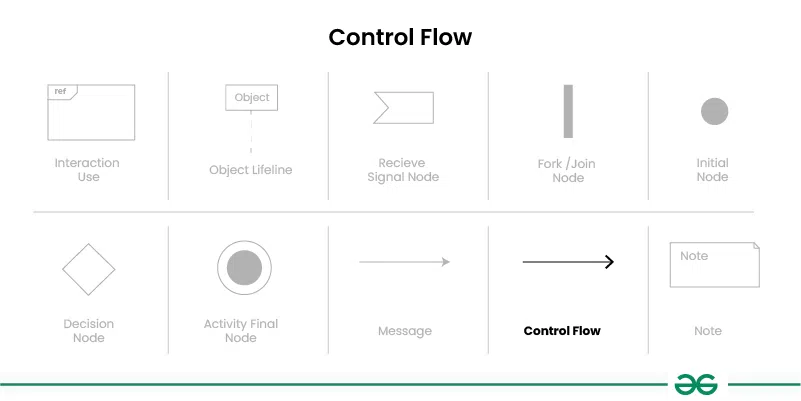
Represents the flow of control or sequence of actions in the interaction. It is shown as a solid arrow between elements in the diagram, indicating the order in which actions are performed.
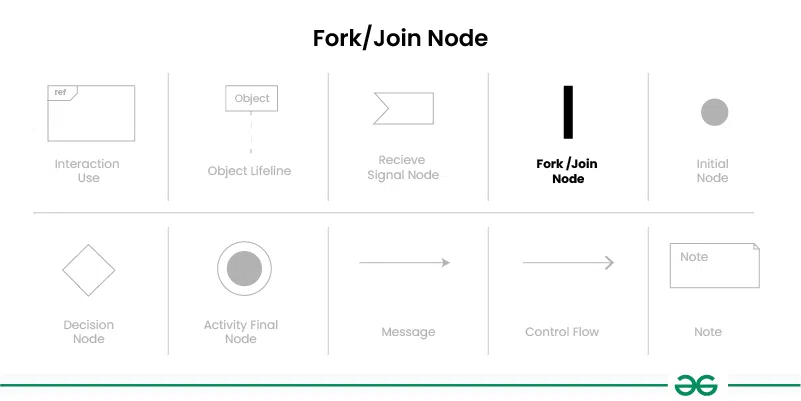
Represents a point in the interaction where multiple parallel actions can occur simultaneously. It is shown as a solid rectangle with multiple outgoing control flow arrows in case of Fork Node and ingoing control flow arrows in case of Join Node.
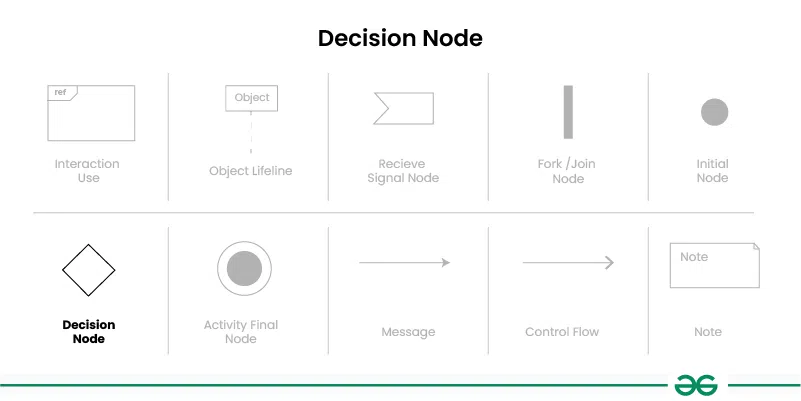
Represents a point in the interaction where a decision is made based on a condition. It is shown as a small diamond shape with incoming and outgoing control flow arrows representing different paths based on the decision.
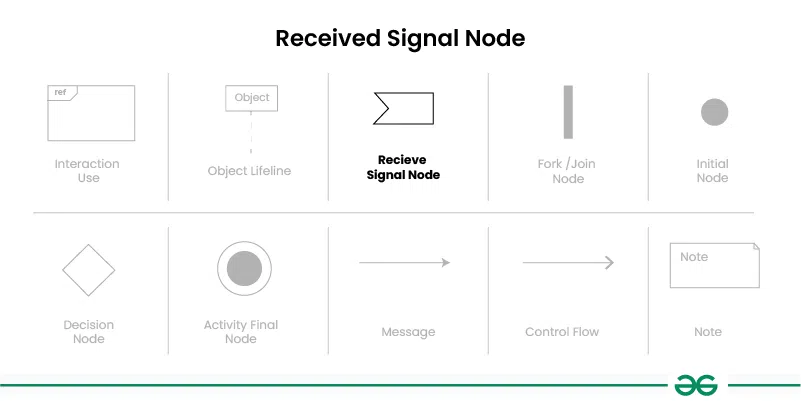
Represents the receipt of a signal or event during the interaction. It is shown as a small rectangle with an incoming control flow arrow.
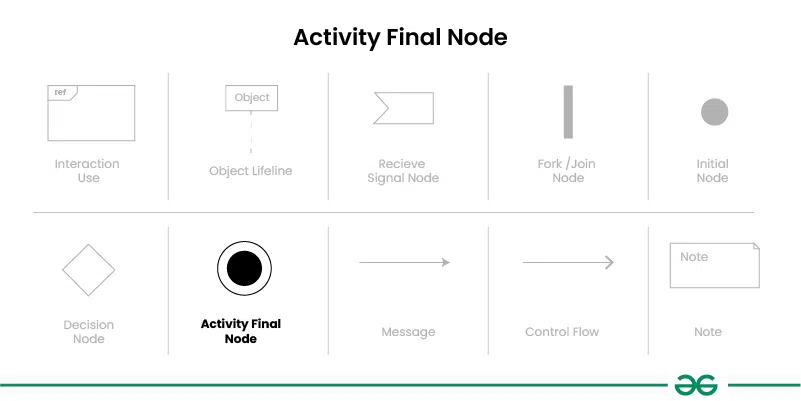
Represents the ending point of the interaction. It is shown as a small solid circle with no outgoing control flow arrows.
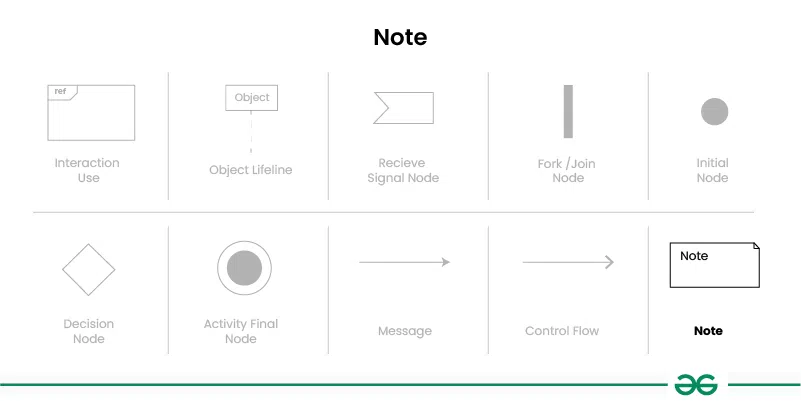
Represents additional information or comments about the diagram. Notes are shown as a small rectangle with a label indicating the content of the note.
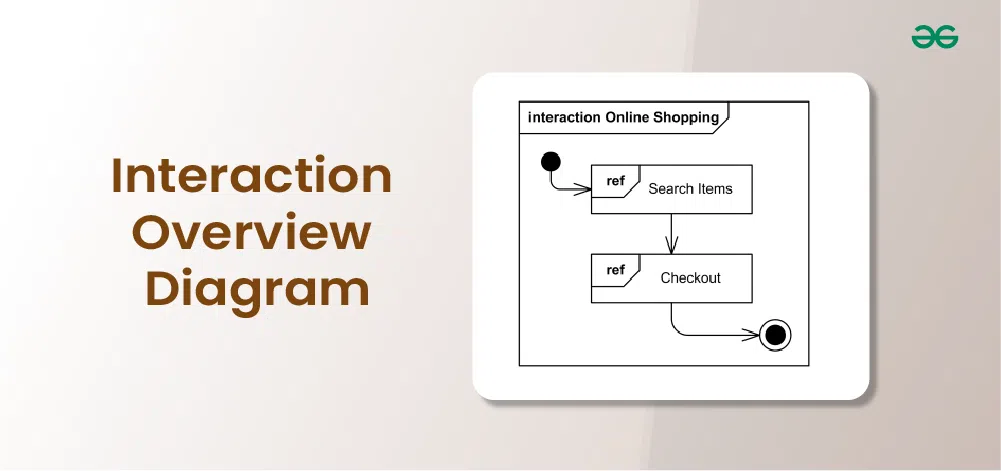
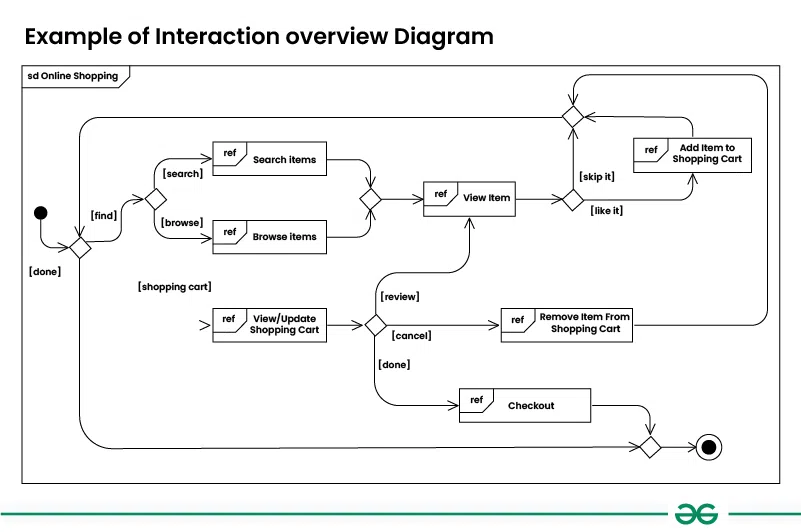
Let's understand interaction overview diagram using an example of online shopping system:
Think about an internet-based shopping platform. The flow of control between different interactions, including logging in, viewing products, adding items to the basket, and checking out, may be displayed in the interaction overview diagram. While fragments might depict concurrent operations like managing inventory updates and creating invoices, decision nodes could stand in for activities like selecting payment options.
👁 Example-of-Interaction-overview-Diagram-2
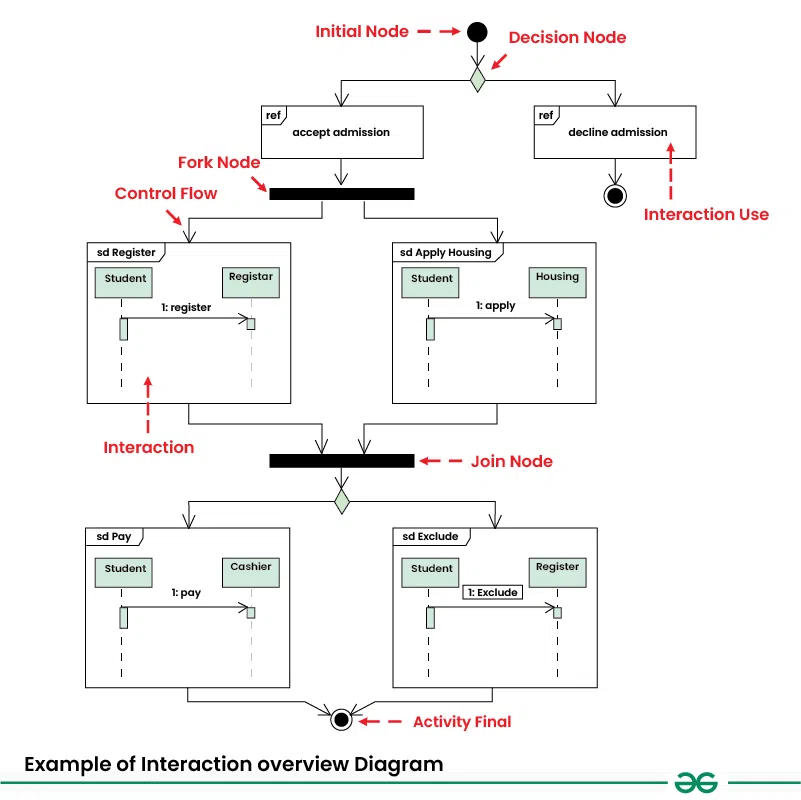
Let's understand interaction overview diagram using Student Admission System :
The below example illustrates the admission process for a student who has been accepted into a university. Initially, the student is required to either accept or decline the admission offer. Upon acceptance, the student must proceed to register for classes and apply for housing. Once these steps are completed, the student is then required to make payment to the registrar. Failure to submit payment on time will result in the student being excluded by the registrar.
👁 Example-of-Interaction-overview-Diagram-
Below are the steps to draw interaction overview diagram:
Identify the interactions between different elements in your system or process that you want to represent in the diagram. These interactions can include method calls, message exchanges, and other types of communication.
Determine the types of fragments you will need to use to represent the interactions. This includes identifying loops, alternatives, options, and parallel sequences in the interactions.
Draw vertical dashed lines (lifelines) for each object or component involved in the interactions. Label each lifeline with the name or class of the object.
Use arrows to represent messages between lifelines, indicating the flow of communication between objects. Label the arrows with the type of message (synchronous, asynchronous, return).
Use rectangular boxes to represent fragments, such as combined fragments, interaction operands, or interaction uses. Label each fragment with the type of fragment or the interaction being referenced.
Use control flow arrows to connect fragments and elements in the diagram, indicating the flow of control between them. Use solid arrows for regular control flow and dashed arrows for exception flow.
Use small circles to represent control nodes, such as decision nodes, fork nodes, initial nodes, and final nodes. Place them at appropriate points in the diagram to indicate decisions, parallel actions, and the start and end of the interaction.
Review the diagram to ensure that it accurately represents the interactions and behavior of the system. Validate the diagram against the requirements and specifications of the system to ensure correctness.
If necessary, refine the diagram based on feedback and further analysis. Iterate on the diagram until you have a clear and accurate representation of the interactions in the system.
The following programs and software tools can be used to create Interaction Overview Diagrams:
Interaction overview diagrams are crucial parts of the UML toolkit that provide a broad perspective on system activities. Their proficiency in simplifying intricate relationships into a broad overview renders them important in several facets of system conception, evaluation, and record-keeping. These diagrams are essential for improving stakeholder understanding and collaboration because they highlight complex relationships and allow for efficient communication.