 |
VOOZH | about |
|
VOOZH | about |
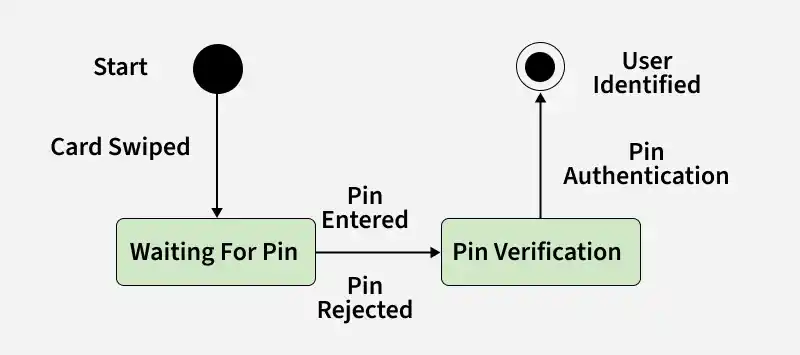
A State Machine Diagram is a behavioral UML diagram used to represent how an object or system changes its state in response to events over time. It models the lifecycle of an object by showing different states and the transitions between them.
Example: In the ATM verification process shown in the diagram, the system moves from Waiting for PIN to PIN Verification when the user enters the PIN. If the PIN is authenticated successfully, the system transitions to the User Identified state.
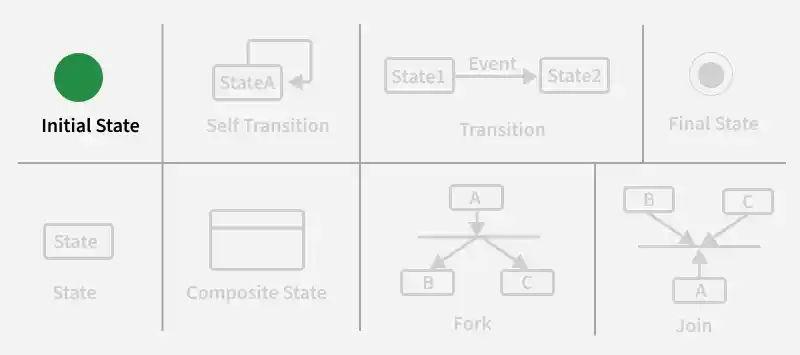
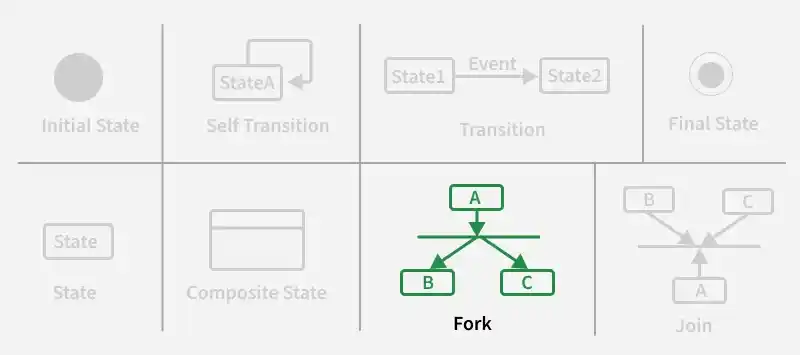
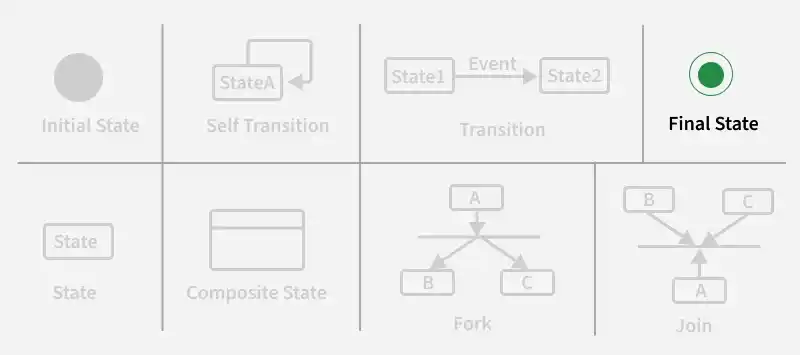
The basic components and their notations of a State Machine Diagram are:
We use a black filled circle represent the initial state of a System or a Class.
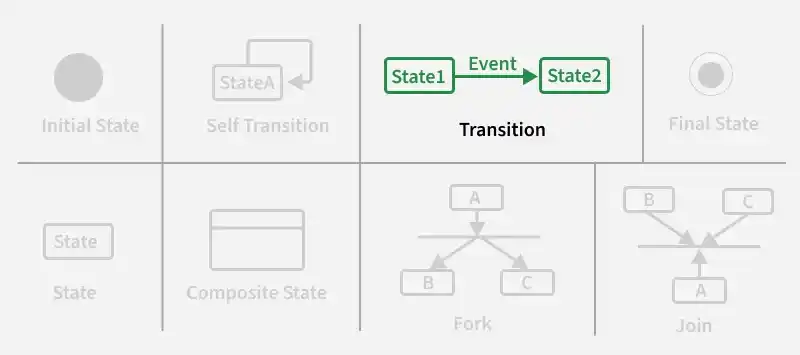
We use a solid arrow to represent the transition or change of control from one state to another. The arrow is labelled with the event which causes the change in state.
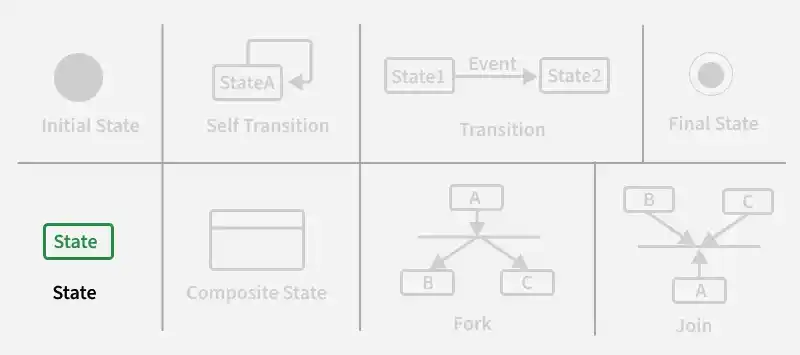
We use a rounded rectangle to represent a state. A state represents the conditions or circumstances of an object of a class at an instant of time.
We use a rounded solid rectangular bar to represent a Fork notation with incoming arrow from the parent state and outgoing arrows towards the newly created states. We use the fork notation to represent a state splitting into two or more concurrent states.
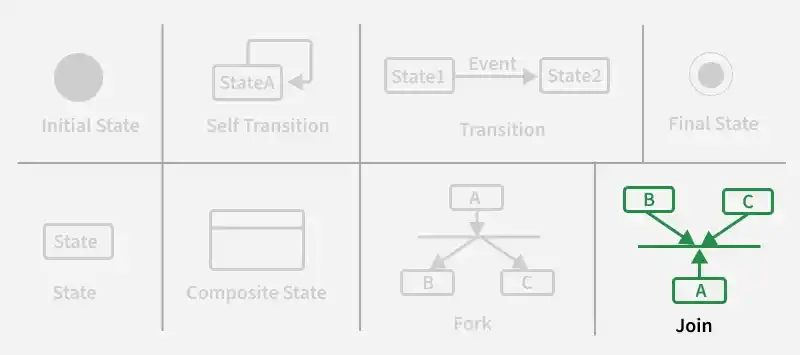
We use a rounded solid rectangular bar to represent a Join notation with incoming arrows from the joining states and outgoing arrow towards the common goal state. We use the join notation when two or more states concurrently converge into one on the occurrence of an event or events.
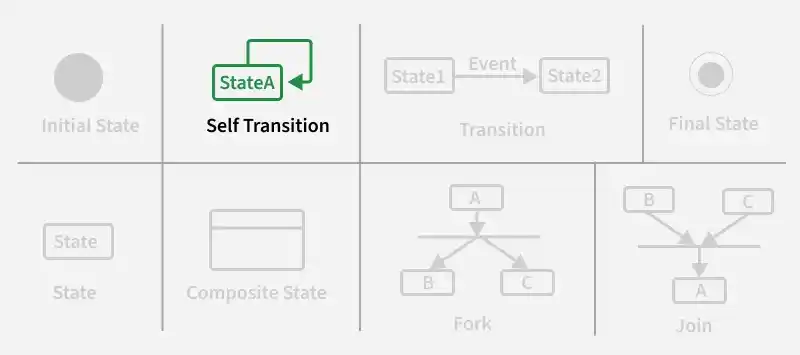
We use a solid arrow pointing back to the state itself to represent a self transition. There might be scenarios when the state of the object does not change upon the occurrence of an event. We use self transitions to represent such cases.
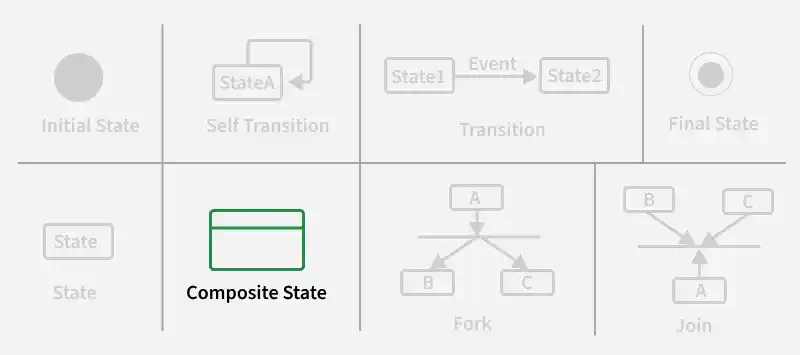
We use a rounded rectangle to represent a composite state also. We represent a state with internal activities using a composite state.
We use a filled circle within a circle notation to represent the final state in a state machine diagram.
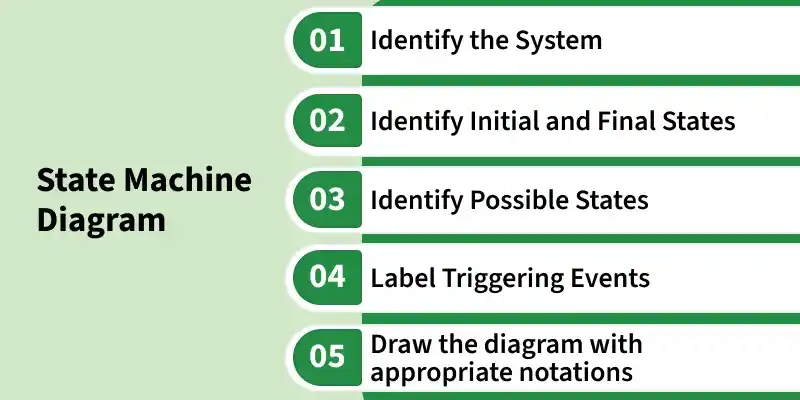
Below are the steps on how to draw the State Machine Diagram in UML
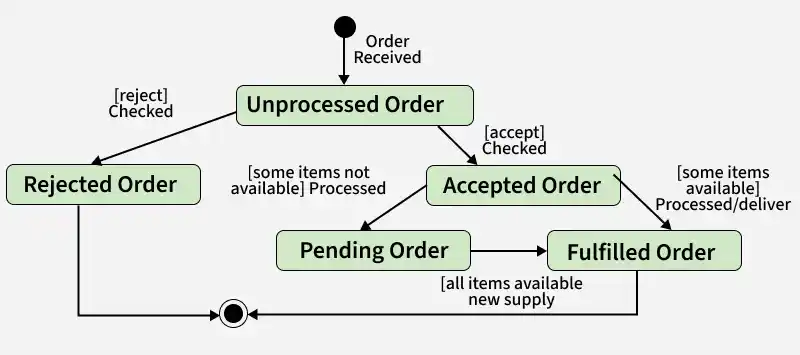
Let's understand State Machine diagram with the help of an example, ie for an Online Order
The UML diagrams we draw depend on the system we aim to represent. Here is just an example of how an online ordering system might look like :
Note: Here we could have also treated fulfilled order and rejected order as final states separately.
The main use cases of state machine diagram are:
| State Machine Diagram | Flowchart |
|---|---|
| Represents different states of a system/object and transitions between them | Represents the step-by-step flow of a process or algorithm |
| Focuses on state changes caused by events | Focuses on execution flow and decision-making steps |
| Behavioral UML diagram | Process/algorithm representation diagram |
| Used for modeling dynamic behavior and object lifecycle | Used for modeling workflows and business processes |
| Uses states, transitions, events, and initial/final states | Uses process blocks, decision symbols, and arrows |
| Shows how an object behaves over time in different states | Shows how control moves from one step to another |
| Best suited for complex state-dependent systems | Best suited for simple procedural workflows |
| Example: ATM states like Card Inserted -> PIN Verification -> Authenticated | Example: ATM process like Insert Card -> Enter PIN -> Validate PIN -> Show Menu |