
This is our ongoing series of Linux Commands and Linux Performance Monitoring, in this article, you will learn about Vmstat and Iostat commands, which are available on all major Unix-like (Linux/Unix/FreeBSD/Solaris) Operating Systems.
vmstat command (also known as virtual memory statistic tool) shows information about processes, memory, disk, and CPU activity in Linux, whereas the iostat command is used to monitor CPU utilization, system input/output statistics for all the disks and partitions.
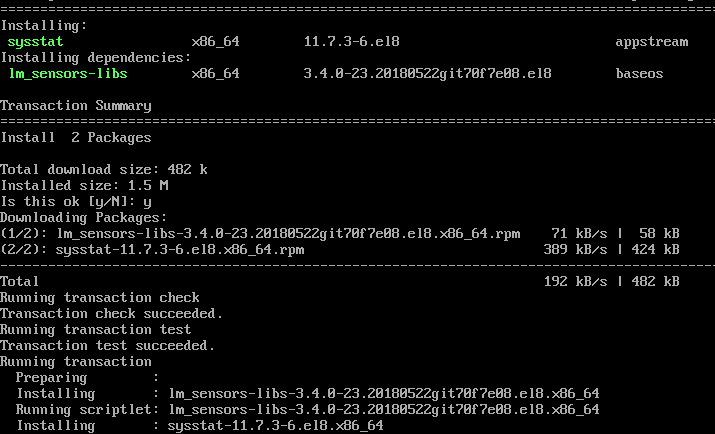
If vmstat and iostat commands are not available in your Linux machine, please install the sysstat package. The vmstat, sar, and iostat commands are the collection of package included in sysstat – the system monitoring tools.
You may download and install sysstat using the source tarball from link sysstat, but we recommend installing through the package manager.
Install Sysstat in Linux
$ sudo apt install sysstat [On Debian, Ubuntu and Mint]
$ sudo yum install sysstat [On RHEL/CentOS/Fedora and Rocky Linux/AlmaLinux]
$ sudo emerge -a app-admin/sysstat [On Gentoo Linux]
$ sudo pacman -S sysstat [On Arch Linux]
$ sudo zypper install sysstat [On OpenSUSE]
Learn Vmstat Command Examples in Linux
In this section, you will learn about 6 vmstat command examples and usage with screenshots.
1. List Active and Inactive Memory
In the below example, there are six columns. The significance of the columns are explained on the man page of vmstat in detail. The most important fields are free under memory and si, so under the swap column.
[root@tecmint ~]# vmstat -a

procs -----------memory---------- ---swap-- -----io---- --system-- -----cpu-----
 r b swpd free inact active si so bi bo in cs us sy id wa st
 1 0 0 810420 97380 70628 0 0 115 4 89 79 1 6 90 3 0
- Free – Amount of free/idle memory spaces.
- si – Swapped in every second from disk in KiloBytes.
- so – Swapped out every second to disk in KiloBytes.
Note: If you run vmstat without parameters it will display a summary report since system boot.
2. Execute vmstat ‘X’ seconds and (‘Number of times)
With this command, vmstat execute every two seconds and stop automatically after executing six intervals.
[root@tecmint ~]# vmstat 2 6

procs -----------memory---------- ---swap-- -----io---- --system-- -----cpu-----
 r b swpd free buff cache si so bi bo in cs us sy id wa st
 0 0 0 810420 22064 101368 0 0 56 3 50 57 0 3 95 2 0
 0 0 0 810412 22064 101368 0 0 0 0 16 35 0 0 100 0 0
 0 0 0 810412 22064 101368 0 0 0 0 14 35 0 0 100 0 0
 0 0 0 810412 22064 101368 0 0 0 0 17 38 0 0 100 0 0
 0 0 0 810412 22064 101368 0 0 0 0 17 35 0 0 100 0 0
 0 0 0 810412 22064 101368 0 0 0 0 18 36 0 1 100 0 0
3. Vmstat with Timestamps
vmstat command with -t parameter shows timestamps with every line printed as shown below.
[tecmint@tecmint ~]$ vmstat -t 1 5

procs -----------memory---------- ---swap-- -----io---- --system-- -----cpu------ ---timestamp---
 r b swpd free buff cache si so bi bo in cs us sy id wa st
 0 0 0 632028 24992 192244 0 0 70 5 55 78 1 3 95 1 0 2012-09-02 14:57:18 IST
 1 0 0 632028 24992 192244 0 0 0 0 171 514 1 5 94 0 0 2012-09-02 14:57:19 IST
 1 0 0 631904 24992 192244 0 0 0 0 195 600 0 5 95 0 0 2012-09-02 14:57:20 IST
 0 0 0 631780 24992 192244 0 0 0 0 156 524 0 5 95 0 0 2012-09-02 14:57:21 IST
 1 0 0 631656 24992 192244 0 0 0 0 189 592 0 5 95 0 0 2012-09-02 14:57:22 IST
4. Statistics of Various Counter
vmstat command with -s switch displays summary of various event counters and memory statistics.
[tecmint@tecmint ~]$ vmstat -s

 1030800 total memory
 524656 used memory
 277784 active memory
 185920 inactive memory
 506144 free memory
 26864 buffer memory
 310104 swap cache
 2064376 total swap
 0 used swap
 2064376 free swap
 4539 non-nice user cpu ticks
 0 nice user cpu ticks
 11569 system cpu ticks
 329608 idle cpu ticks
 5012 IO-wait cpu ticks
 79 IRQ cpu ticks
 74 softirq cpu ticks
 0 stolen cpu ticks
 336038 pages paged in
 67945 pages paged out
 0 pages swapped in
 0 pages swapped out
 258526 interrupts
 392439 CPU context switches
 1346574857 boot time
 2309 forks
5. Monitor Linux Disks Statistics
vmstat with -d option display all disks statistics of Linux.
[tecmint@tecmint ~]$ vmstat -d

disk- ------------reads------------ ------------writes----------- -----IO------
 total merged sectors ms total merged sectors ms cur sec
ram0 0 0 0 0 0 0 0 0 0 0
ram1 0 0 0 0 0 0 0 0 0 0
ram2 0 0 0 0 0 0 0 0 0 0
ram3 0 0 0 0 0 0 0 0 0 0
ram4 0 0 0 0 0 0 0 0 0 0
ram5 0 0 0 0 0 0 0 0 0 0
ram6 0 0 0 0 0 0 0 0 0 0
ram7 0 0 0 0 0 0 0 0 0 0
ram8 0 0 0 0 0 0 0 0 0 0
ram9 0 0 0 0 0 0 0 0 0 0
ram10 0 0 0 0 0 0 0 0 0 0
ram11 0 0 0 0 0 0 0 0 0 0
ram12 0 0 0 0 0 0 0 0 0 0
ram13 0 0 0 0 0 0 0 0 0 0
ram14 0 0 0 0 0 0 0 0 0 0
ram15 0 0 0 0 0 0 0 0 0 0
loop0 0 0 0 0 0 0 0 0 0 0
loop1 0 0 0 0 0 0 0 0 0 0
loop2 0 0 0 0 0 0 0 0 0 0
loop3 0 0 0 0 0 0 0 0 0 0
loop4 0 0 0 0 0 0 0 0 0 0
loop5 0 0 0 0 0 0 0 0 0 0
loop6 0 0 0 0 0 0 0 0 0 0
loop7 0 0 0 0 0 0 0 0 0 0
sr0 0 0 0 0 0 0 0 0 0 0
sda 7712 5145 668732 409619 3282 28884 257402 644566 0 126
dm-0 11578 0 659242 1113017 32163 0 257384 8460026 0 126
dm-1 324 0 2592 3845 0 0 0 0 0 2
6. Display Statistics in Megabytes
The vmstat displays memory statistics in kilobytes by default, but you can also display reports with memory sizes in megabytes with the argument -S M. Consider the following example.
[root@tecmint ~]# vmstat -S M 1 5

procs -----------memory---------- ---swap-- -----io---- --system-- -----cpu-----
 r b swpd free buff cache si so bi bo in cs us sy id wa st
 0 0 0 346 53 476 0 0 95 8 42 55 0 2 96 2 0
 0 0 0 346 53 476 0 0 0 0 12 15 0 0 100 0 0
 0 0 0 346 53 476 0 0 0 0 32 62 0 0 100 0 0
 0 0 0 346 53 476 0 0 0 0 15 13 0 0 100 0 0
 0 0 0 346 53 476 0 0 0 0 34 61 0 1 99 0 0
Learn Iostat Command Examples in Linux
In this section, you will learn about 6 iostat command examples and usage with screenshots.
7. Display CPU and I/O Statistics of Disks
iostat without arguments displays CPU and I/O statistics of all partitions as shown below.
[root@tecmint ~]# iostat

Linux 2.6.32-279.el6.i686 (tecmint.com) 09/03/2012 _i686_ (1 CPU)

avg-cpu: %user %nice %system %iowait %steal %idle
 0.12 0.01 1.54 2.08 0.00 96.24

Device: tps Blk_read/s Blk_wrtn/s Blk_read Blk_wrtn
sda 3.59 161.02 13.48 1086002 90882
dm-0 5.76 159.71 13.47 1077154 90864
dm-1 0.05 0.38 0.00 2576 0
8. Shows Linux CPU Statistics
iostat with -c arguments displays only CPU statistics as shown below.
[root@tecmint ~]# iostat -c

Linux 2.6.32-279.el6.i686 (tecmint.com) 09/03/2012 _i686_ (1 CPU)

avg-cpu: %user %nice %system %iowait %steal %idle
 0.12 0.01 1.47 1.98 0.00 96.42
9. Shows Linux Disks I/O Statistics
iostat with -d arguments display only disk I/O statistics of all partitions as shown.
[root@tecmint ~]# iostat -d

Linux 2.6.32-279.el6.i686 (tecmint.com) 09/03/2012 _i686_ (1 CPU)

Device: tps Blk_read/s Blk_wrtn/s Blk_read Blk_wrtn
sda 3.35 149.81 12.66 1086002 91746
dm-0 5.37 148.59 12.65 1077154 91728
dm-1 0.04 0.36 0.00 2576 0
10. Shows I/O Statistics of Specific Device
By default, it displays statistics of all partitions, with -p and device name arguments display only disks I/O statistics for specific device only as shown.
[root@tecmint ~]# iostat -p sda

Linux 2.6.32-279.el6.i686 (tecmint.com) 09/03/2012 _i686_ (1 CPU)

avg-cpu: %user %nice %system %iowait %steal %idle
 0.11 0.01 1.44 1.92 0.00 96.52

Device: tps Blk_read/s Blk_wrtn/s Blk_read Blk_wrtn
sda 3.32 148.52 12.55 1086002 91770
sda1 0.07 0.56 0.00 4120 18
sda2 3.22 147.79 12.55 1080650 91752
11. Display LVM Statistics
With -N (Uppercase) parameter displays only LVM statistics as shown.
[root@tecmint ~]# iostat -N

Linux 2.6.32-279.el6.i686 (tecmint.com) 09/03/2012 _i686_ (1 CPU)

avg-cpu: %user %nice %system %iowait %steal %idle
 0.11 0.01 1.39 1.85 0.00 96.64

Device: tps Blk_read/s Blk_wrtn/s Blk_read Blk_wrtn
sda 3.20 142.84 12.16 1086002 92466
vg_tecmint-lv_root 5.13 141.68 12.16 1077154 92448
vg_tecmint-lv_swap 0.04 0.34 0.00 2576 0
12. Check Iostat Version
With -V (Uppercase) parameter display version of iostat as shown.
[root@tecmint ~]# iostat -V

sysstat version 11.7.3
(C) Sebastien Godard (sysstat orange.fr)
The vmstat and iostat contain a number of columns and flags which may not possible to explain in detail. If you want to know more about it you may refer man page of vmstat and iostat.
# man vmstat
# man iostat
Please share it if you find this article is useful through our comment box below.
If this article helped you solve a problem, consider buying a coffee. It helps keep TecMint free, supports the authors, and keeps the project going.
Got Something to Say? Join the Discussion... Cancel reply