 |
VOOZH | about |
|
VOOZH | about |
This article was published as a part of the Data Science Blogathon
Pandas is a library generally used for data manipulation and data analysis. Pandas is used to handle tabular data. In particular, it provides the data structure as well as functionality for managing numerical tables and time series. The name ‘Pandas’ is derived from the term “panel data”, which means an econometrics term for data sets. One shall use Pandas heavily for data manipulation, visualization, building machine learning models, etc. There are two sorts of data structures in Pandas –
Installing pandas using the following command on the conda command prompt.
(base)$ source virtualenv_name/bin/activate
(virtualenv_name) $ pip install pandas
Once Pandas is successfully installed in your system, you can import Pandas simply by,
import pandas as pd
where pd is an alias used for Pandas so that the Pandas package can be referred to as pd instead of pandas.
# A pandas series
pd.Series( [ 12, 13, 1, 3, 5 ] )
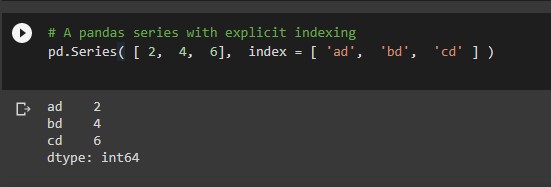
# A pandas series with explicit indexing
pd.Series( [ 2,  4,  6],  index = [ 'ad',  'bd',  'cd' ] )
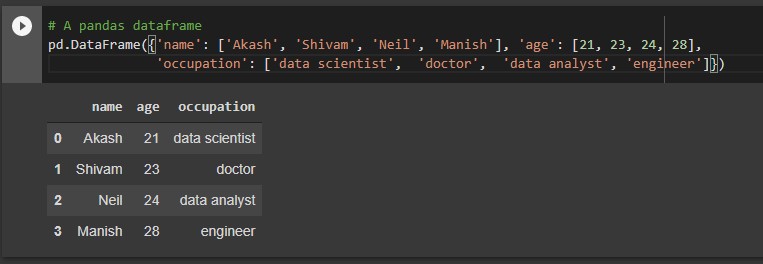
# A pandas dataframe
pd.DataFrame({'name': ['Akash', 'Shivam', 'Neil', 'Manish'], 'age': [21, 23, 24, 28],'occupation': ['data scientist',  'doctor',  'data analyst', 'engineer']})
The below code will set the specified column as an index of the dataframe.
# setting a  column as index
df.set_index('col_name' ,  inplace = True)
The below code will sort the dataframe
# sorting the dataframe by index
df.sort_index(axis = 0,  ascending = False)
The below code will sort the dataframe based on column values specified.
 # sorting the data frame by a column
df.sort_values(by = 'col_name', ascending = False)
The below code will return the total number of rows and columns as a tuple.
#Checking the shape of a dataframe
df.shape
dataframe.head(n): This function will return the first n rows of the data frame. By default, it gives the first 5 rows if n is not given explicitly.
#Viewing top 5 rows of the data frame
df.head()
#One can view any number of top rows by
df.head(3)
df.head(15)
dataframe.tail(n): This function will return the last n rows of the data frame. By default, it gives the last 5 rows if n is not given explicitly.
#viewing bottom 5 rows
df.tail()
#One can view any number of bottom number
df.tail(10)
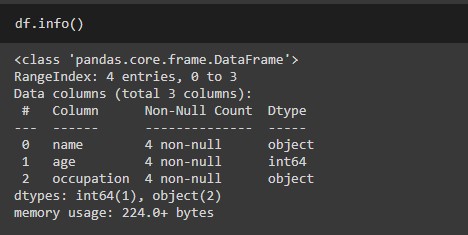
dataframe.info(): This method prints all the information about a DataFrame which includes the index dtype and columns, non-null values for each column, and memory usage for the overall data frame.
Let’s check the info for the dataframe that we created earlier
# metadata summary
df.info()
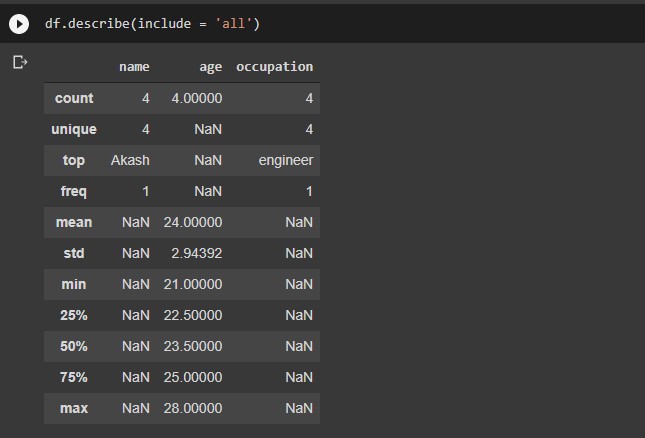
dataframe.describe() includes Descriptive statistics includes summary like central tendency, min, max, and shape of a dataset’s distribution, excluding null values for the numerical column. And summary like count, frequency, etc for categorical columns.
Let’s check the output of this function for the data frame we created earlier.
# statistical summary
df.describe()
#Returns the memory consumed by columns
df.memory_usage()
#Returns the columns of the data frame as a array
df.columns
#Returns the values as an array
data.values
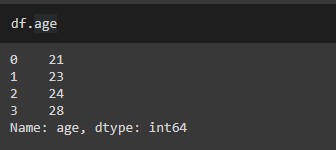
# Extract a specific column as a series
df[ 'col_name' ]
df.col_name
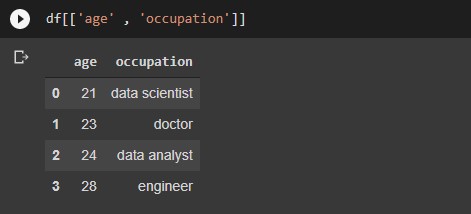
#Extracting multiple columns at a time
df[ [ 'col_1',  'col_2',  'col_3' ] ]
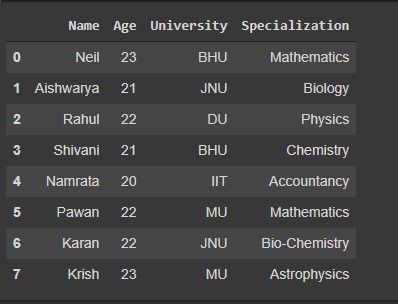
Let’s define a data frame so that we can implement the following codes
df = pd.DataFrame( {
 'Name' : ['Neil', 'Aishwarya', 'Rahul', 'Shivani','Namrata','Pawan', 'Karan','Krish'],
 'Age' : [23, 21, 22, 21, 20, 22, 22, 23],
 'University' : ['BHU', 'JNU', 'DU', 'BHU', 'IIT', 'MU', 'JNU', 'MU'],
 'Specialization' : ['Mathematics' , 'Biology', 'Physics' , 'Chemistry', 'Accountancy', 'Mathematics', 'Bio-Chemistry', 'Astrophysics']
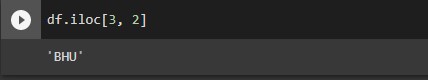
# Extracting a particular column and row from dataframe. dataframe.iloc[m,n] where m is row index and n is column index
 df.iloc[3, 5]   # single element 4throw and 6th column
Output:
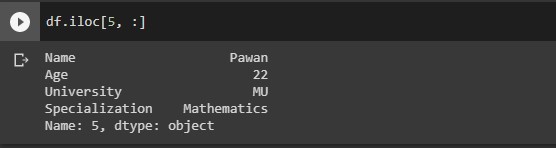
#Extracting a specific row with all columns
df.iloc[5, :] # single row and all columns
Output:
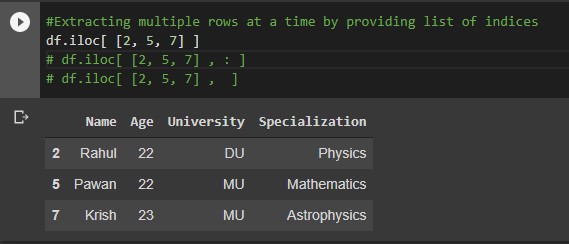
#Extracting multiple rows at a time by providing list of indices
df.iloc[ [2, 5, 7] ]
df.iloc[ [2, 5, 7] , : ]
df.iloc[ [2, 5, 7] ,  ]
Output:
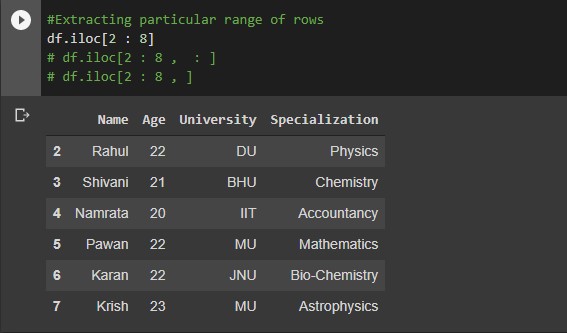
#Extracting particular range of rows
df.iloc[2 : 8]
df.iloc[2 : 8 ,  : ]
df.iloc[2 : 8 , ]
Output:
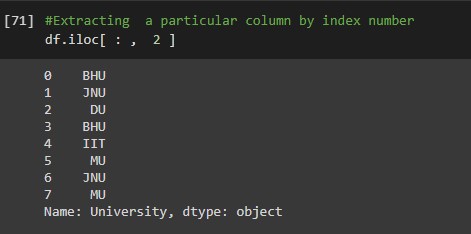
#Extracting  a particular column by index number
df.iloc[ : ,  2 ]
Output:
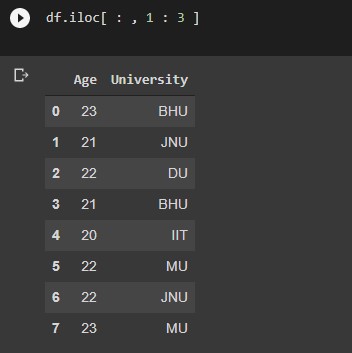
#Extracting particular range of columns
df.iloc[ : , 1 : 3 ]
Output:
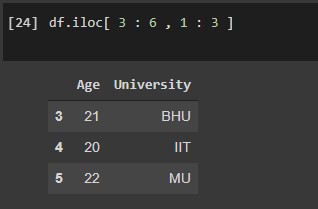
#Extracting rows and columns of a particular range
df.iloc[ 3 : 6 , 1 : 3 ]
Output:
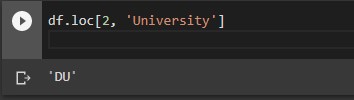
#Extracting rows and columns based on column or row labels
df.loc[2, 'col_name'] # single element row label 2 and column sales
output:
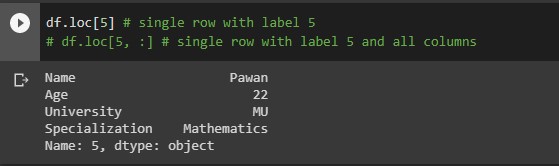
df.loc[5] # single row with label 5
df.loc[5, :] # single row with label 5 and all columns
Output:
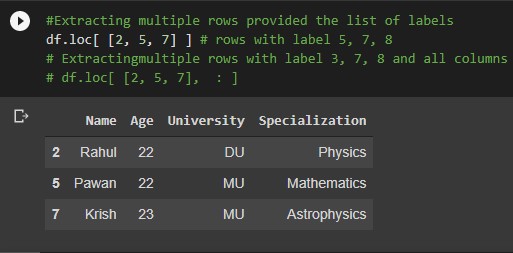
#Extracting multiple rows provided the list of labels
df.loc[ [2, 5, 7] ] # rows with label 5, 7, 8
# Extracting multiple rows with label 3, 7, 8 and all columns
df.loc[ [2, 5, 7],  : ]
Output:
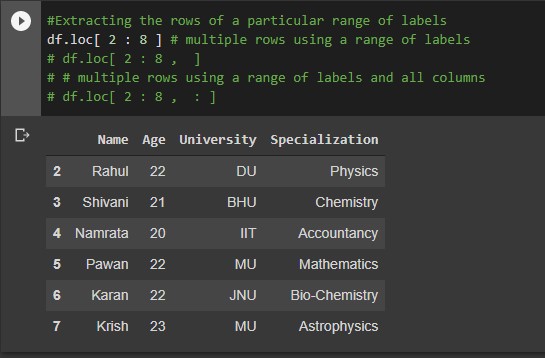
#Extracting the rows of a particular range of labels
df.loc[ 2 : 8 ] # multiple rows using a range of labels
df.loc[ 2 : 8 ,  ]
# multiple rows using a range of labels and all columns
df.loc[ 2 : 8 ,  : ]
Output:
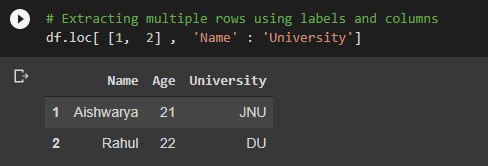
# Extracting multiple rows using labels and columns
df.loc[ [1,  2] ,  'col_1' : 'col_2']
Output:
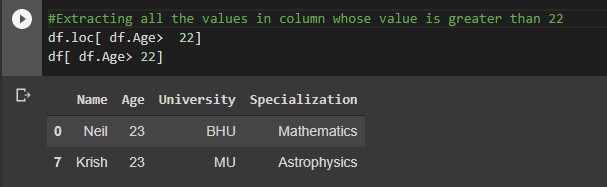
Here we can extract specific columns or rows satisfying a particular condition.
#Extracting all the values in column whose value is greater than 22
df.loc[ df.Age>  22]
df[ df.Age> 22]
Output:
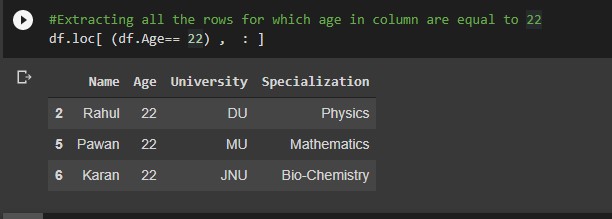
#Extracting all the rows for which age in column are equal to 22
df.loc[ (df.Age== 22) ,  : ]
Output:
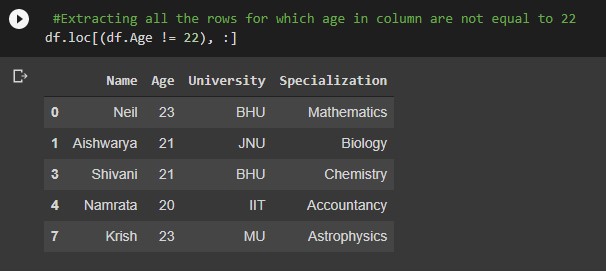
 #Extracting all the rows for which age in column are not equal to 22
df.loc[(df.Age != 22), :]
Output:
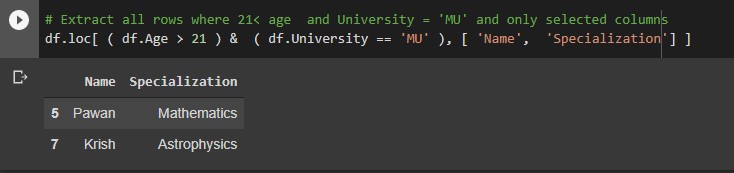
Multiple conditioning
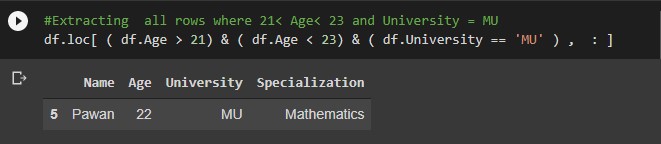
#Extracting  all rows where 21< Age< 23 and University = MU
df.loc[ ( df.Age > 21) & ( df.Age < 23) & ( df.University == 'MU' ) ,  : ]
Output:
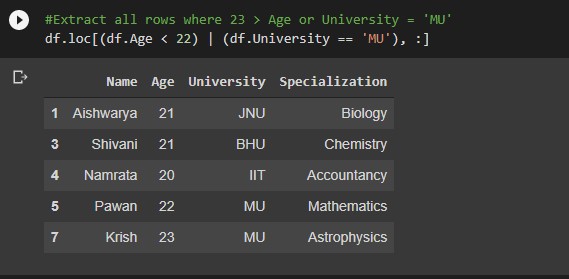
#Extract all rows where 22 > Age or University = 'MU'
df.loc[(df.Age < 22) | (df.University = 'MU'), :]
Output:
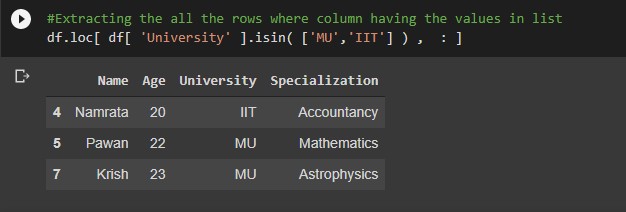
#Extracting the all the rows where column having the values in list
df.loc[ df[ 'University' ].isin( ['MU', 'IIT' ) ,  : ]
Output:
Output:
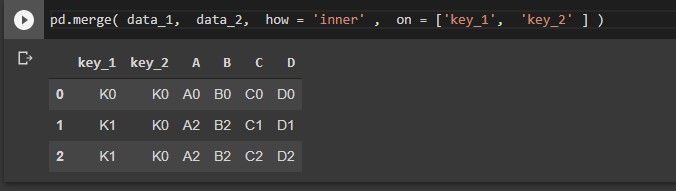
This will merge the DataFrame or pandas Series objects with a database-style join.
Let’s take an example to understand this. First, we will create data frames and then join them with the inner intersection. There are more ways to join the data frames you can check that on official documentation.
data_1 = pd.DataFrame(
 {
 "key_1": ["K0", "K0", "K1", "K2"],
 "key_2": ["K0", "K1", "K0", "K1"],
 "A": ["A0", "A1", "A2", "A3"],
 "B": ["B0", "B1", "B2", "B3"],
 }
 )
data_2 = pd.DataFrame(
 {
 "key_1": ["K0", "K1", "K1", "K2"],
 "key_2": ["K0", "K0", "K0", "K0"],
 "C": ["C0", "C1", "C2", "C3"],
 "D": ["D0", "D1", "D2", "D3"],
 }
 )
#Merging the two dataframesby inner join on particular columns
pd.merge( data_1,  data_2,  how = 'inner' ,  on = ['col_1',  'col_2' ] )
Output:
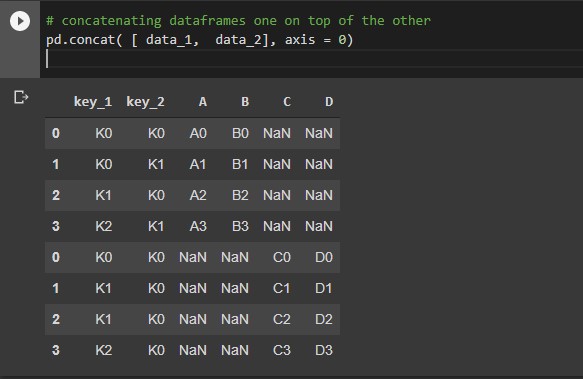
Concatenating pandas objects along the specified axis. you can get additional information from the link given above.
# concatenating dataframes one on top of the other
 pd.concat( [ data_1,  data_2], axis = 0)
Output:
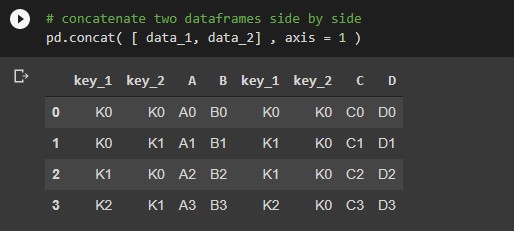
# concatenate two dataframes side by side
pd.concat( [ data_1, data_2] , axis = 1 )
Output:
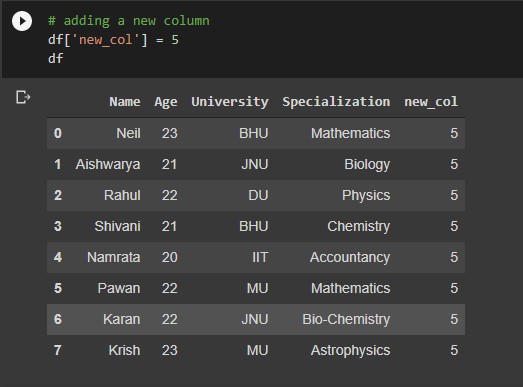
# adding a new column
df['new_col'] = any_value
Output:
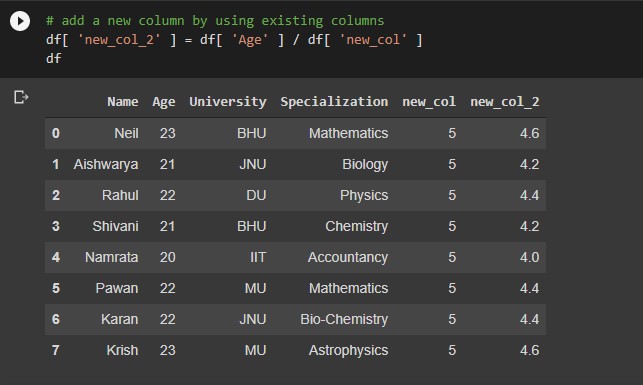
# add a new column by using existing columns
df[ 'new_col' ] = df[ 'col_1' ] / df[ 'col_2' ]
Output:
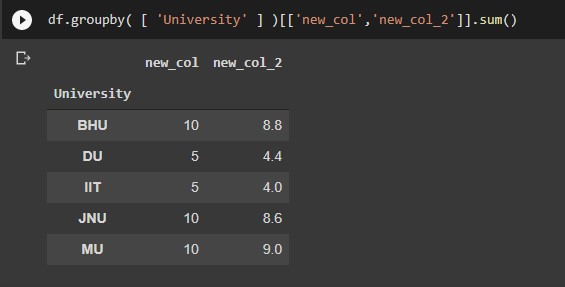
# grouping the data by specific columns
df.groupby( [ 'col_1' ,  'col_2' ] )
#Grouping the data by specific columns and aggregating
df.groupby( [ 'col_1' ,  'col_2' ] )['col_3'].sum()
df.groupby( [ 'col_1' , 'col_2' ] )['col_3'].mean()
Output:
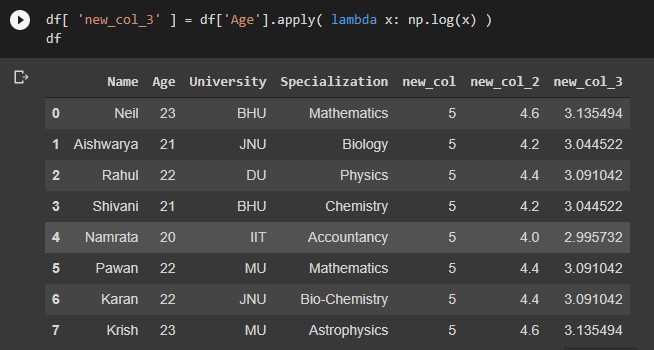
df[ 'col_1' ].apply( lambda x: function(x) )
df[ 'col_1' ].apply( lambda x: np.log(x) ) #Invuilt function
Output:
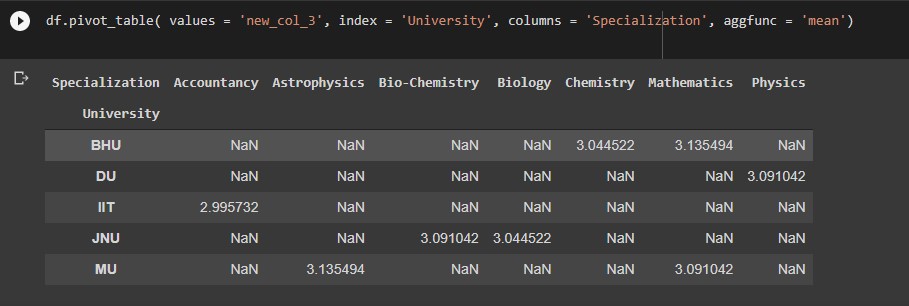
Creating a spread-sheet like pivot table as a Dataframe
df.pivot_table( values = 'aggregation_col', index = 'group_by_row', columns = 'group_by_col', aggfunc = 'mean')
Output:
There are many more pandas operations that one can try or apply. I hope u enjoyed the article and got an idea of pandas.
A Mathematics student turned Data Scientist. I am an aspiring data scientist who aims at learning all the necessary concepts in Data Science in detail. I am passionate about Data Science knowing data manipulation, data visualization, data analysis, EDA, Machine Learning, etc which will help to find valuable insights from the data.
GPT-4 vs. Llama 3.1 – Which Model is Better?
Llama-3.1-Storm-8B: The 8B LLM Powerhouse Surpa...
A Comprehensive Guide to Building Agentic RAG S...
Top 10 Machine Learning Algorithms in 2026
45 Questions to Test a Data Scientist on Basics...
90+ Python Interview Questions and Answers (202...
8 Easy Ways to Access ChatGPT for Free
Prompt Engineering: Definition, Examples, Tips ...
What is LangChain?
What is Retrieval-Augmented Generation (RAG)?
Edit
Resend OTP
Resend OTP in 45s