 |
VOOZH | about |
|
VOOZH | about |
This article was published as a part of the Data Science Blogathon.
Aggregating is the process of getting some data together and it is considered an important concept in big data analytics. You need to define a key or grouping in aggregation. You can also define an aggregation function that specifies how the transformations will be performed among the columns. If you give multiple values as input, the aggregation function will generate one result for each group. Spark’s aggregation capabilities are sophisticated and mature, with a variety of different use cases and possibilities. Aggregations are generally used to get the summary of the data. You can count, add and also find the product of the data. Using Spark, you can aggregate any kind of value into a set, list, etc. We will see this in “Aggregating to Complex Types”.
We have some categories in aggregations.
Simple Aggregations
The simplest grouping is to get a summary of a given data frame by using an aggregation function in a select statement.
Grouping Aggregations
A “group by” allows you to specify more than one keys or aggregation function to transform the columns.
Window functions
A “window” provides the functionality to specify one or more keys also one or more aggregation functions to transform the value columns. However, the input rows to the aggregation function are somewhat related to the current row.
All these aggregations in Spark are implemented via built-in functions.
In this article, I am going to discuss simple aggregations.
Here, I am using Apache Spark 3.0.3 version and Hadoop 2.7 version. It can be downloaded here.
I am also using Eclipse Scala IDE. You can download it here.
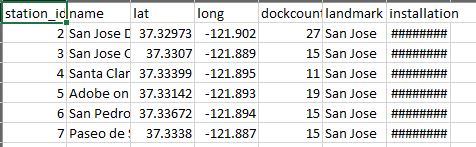
I am using a CSV data file. You can find it on the github page.
The data set contains the following columns.
station_id, name, lat, long, dockcount, landmark, and installation.
This is bike station data.
I am importing all functions here because aggregation is all about using aggregate functions and window functions.
This can be done by using
import org.apache.spark.sql.functions._
Now I am reading the data file into a data frame.
var df = spark.read.format("csv").option("header", "true").option("inferSchema", "true").load("C:\Users\Dhanya\Downloads\201508_station_data.csv")
Now, we are ready to do some aggregations. Let’s start with the simplest one.
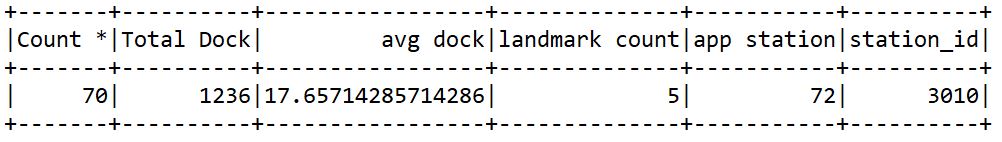
The simplest form of aggregation is to summarize the complete data frame and it is going to give you a single row in the result. For example, you can count the number of records in this data frame and it will return you a single row with the count of records.
Now, we start with the data frame and use the select() method and apply the count function. You can also hive alias to the summary column. You can also add one more summary column for the sum of the dockcount column. You can also compute the average. We also have countDistinct() function. Here, I am counting the unique values of the landmark column. The countDistinct() will give the number of the unique landmark in this data frame. There is another thing called approx_count_distinct(). When we give countDistinct(), it will group the distinct values and count them. What happens when we have a huge dataset with millions of rows. The countDistinct() function will take time. In that case, we can use approx_count_distinct() which will return an approximate count. It is not 100% accurate. We can use this when speed is more important than accuracy. When you want to get the sum of a distinct set of values, you can use the sumDistinct() function.
These functions can
be implemented like this.
df.select(
 count("*").as("Count *"),
 sum("dockcount").alias("Total Dock"),
 avg("dockcount").alias("avg dock"),
 countDistinct("landmark").alias("landmark count"),
 approx_count_distinct("station_id").alias("app station"),
 sumDistinct("station_id").alias("station_id")
 ).show()
The select method will return a new data frame and you can show it.
Let me run this.
The output will be as follows.
So, as expected, we summarized the whole data frame and got one single row in the result.
Great!
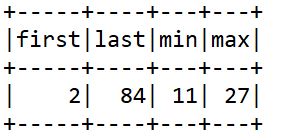
We have many other aggregation functions like first() and last() where you can get the first and last values in a data frame. We can get the minimum and maximum values using min() and max() functions respectively.
This can be done in Scala like this.
df.select(
 first("station_id").alias("first"),
 last("station_id").alias("last"),
 min("dockcount").alias("min"),
 max("dockcount").alias("max")
 ).show()
When we execute this, we will get the following output.
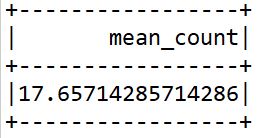
Now, I am going to use selectExpr() where we can pass the SQL like expressions.
df.selectExpr(
 "mean(dockcount) as mean_count"
 ).show()
Here, I am calculating the mean of the dockcount column.
The mean value is displayed.
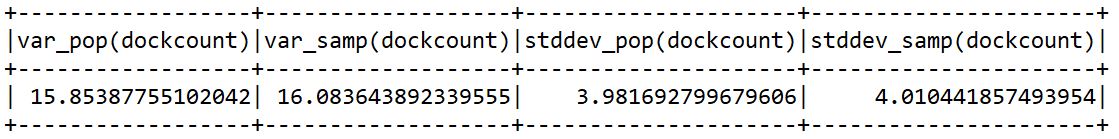
Let’s look into other aggregate functions like variance and standard deviation. As we all know variance is the average of squared differences from the mean and standard deviation is the square root of variance.
They can be calculated by
df.select(
 var_pop("dockcount"),
 var_samp("dockcount"),
 stddev_pop("dockcount"),
 stddev_samp("dockcount")
 ).show()
And the output is
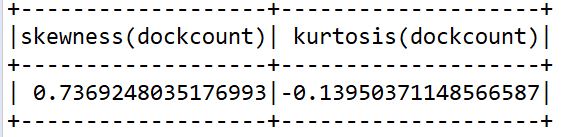
Skewness is the degree of distortion from the normal distribution. It may be positive or negative. Kurtosis is all about the tails of the distribution. It is used to find outliers in the data.
It can be identified by
df.select(
 skewness("dockcount"),
 kurtosis("dockcount")
 ).show()
The output is
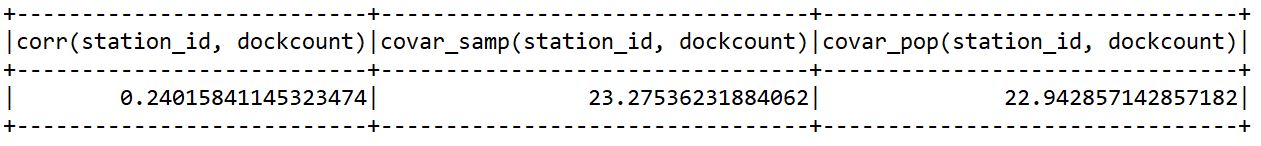
Next, we will see about covariance and correlation. Covariance is the measure of how much two columns or features or variables vary from each other. Correlation is the measure of how much they are related to each other.
It can be calculated by
df.select(
 corr("station_id", "dockcount"),
 covar_samp("station_id", "dockcount"),
 covar_pop("station_id", "dockcount")
 ).show()
The output is
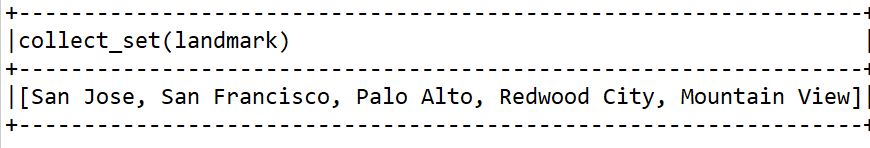
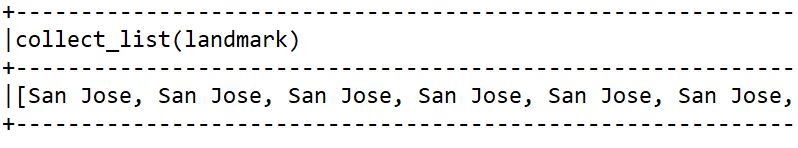
Next, we will see about aggregating to complex types. Suppose if you want to store a particular column in a list or if you need unique values of a column in a list, you can use collect_list() or collect_set(). collect_set() will store the unique values and collect_list() will contain all the elements.
Here is the implementation.
df.agg(collect_set("landmark"), collect_list("landmark")).show(false)
The output is
Here is the entire implementation.
import org.apache.spark.sql.functions._
import org.apache.spark.SparkContext
import org.apache.spark.SparkConf
object demo extends App{
 val conf = new SparkConf().setAppName("Demo").setMaster("local[1]")
 val sc = new SparkContext(conf)
 val spark = org.apache.spark.sql.SparkSession.builder.master("local[1]").appName("Demo").getOrCreate;
 var df = spark.read.format("csv").option("header", "true").option("inferSchema", "true").load("C:\Users\Dhanya\Downloads\201508_station_data.csv")
 df.select(
 count("*").as("Count *"),
 sum("dockcount").alias("Total Dock"),
 avg("dockcount").alias("avg dock"),
 countDistinct("landmark").alias("landmark count"),
 approx_count_distinct("station_id").alias("app station"),
 sumDistinct("station_id").alias("station_id")
 ).show()
 df.select(
 first("station_id").alias("first"),
 last("station_id").alias("last"),
 min("dockcount").alias("min"),
 max("dockcount").alias("max")
 ).show()
 df.selectExpr(
 "mean(dockcount) as mean_count"
 ).show()
 df.select(
 var_pop("dockcount"),
 var_samp("dockcount"),
 stddev_pop("dockcount"),
 stddev_samp("dockcount")
 ).show()
 df.select(
 skewness("dockcount"),
 kurtosis("dockcount")
 ).show()
 df.select(
 corr("station_id", "dockcount"),
 covar_samp("station_id", "dockcount"),
 covar_pop("station_id", "dockcount")
 ).show()
 df.agg(collect_set("landmark"), collect_list("landmark")).show(false)
}
So, these are all simple aggregations. The simple aggregations will always give you a one-line summary. Sometimes, you may want a detailed summary. For example, if you want to combine two or more columns and apply aggregations there. It can be done simply by using Spark SQL. But you can do the same using data frame expressions also. It can be done by the concept of grouping aggregations. I will discuss grouping aggregations in another article. You can find it here.
Predicting the future is not magic. It's an Artificial Intelligence!! This inspired me so much and that's why I love Data Science and Artificial Intelligence. I am currently working as a Data Engineer. I wish to explore more and share my knowledge with others.
GPT-4 vs. Llama 3.1 – Which Model is Better?
Llama-3.1-Storm-8B: The 8B LLM Powerhouse Surpa...
A Comprehensive Guide to Building Agentic RAG S...
Top 10 Machine Learning Algorithms in 2026
45 Questions to Test a Data Scientist on Basics...
90+ Python Interview Questions and Answers (202...
8 Easy Ways to Access ChatGPT for Free
Prompt Engineering: Definition, Examples, Tips ...
What is LangChain?
What is Retrieval-Augmented Generation (RAG)?
Edit
Resend OTP
Resend OTP in 45s