 |
VOOZH | about |
|
VOOZH | about |
This article was published as a part of the Data Science Blogathon.
Any data science task starts with exploratory data analysis to learn more about the data, what is in the data and what is not. Having knowledge of different pandas functions certainly helps to complete the analysis in time.
Therefore, I have listed the top 21 pandas functions covering 80% of your data exploration tasks. This includes pandas functions and methods to –
Note: I’m using a self created Dummy_Sales_Data which you can get on my Github repo for Free & use it for your other practice projects!
Pandas in Python is a widely used library for data manipulation and analysis.
Let’s first import the data into pandas DataFrame df
import pandas as pd
df = pd.read_csv("Dummy_Sales_Data_v1.csv")
You can download a complete notebook with all these examples at the end of this read!
Now, let’s get started!
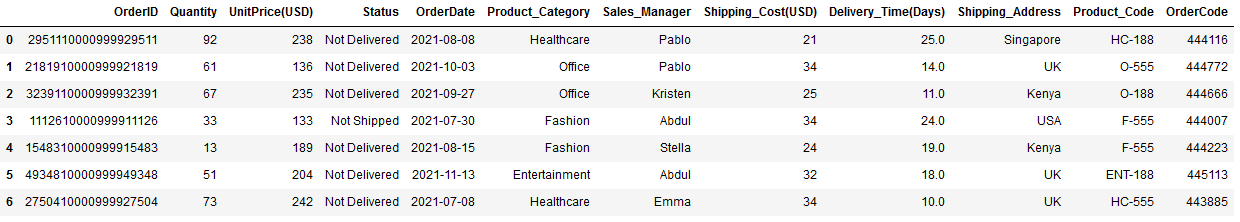
This function helps you to get the first few rows of the dataset. By default, it returns the first 5 rows. However, you can change this number by simply mentioning the desired number of rows in df.head()
For example, suppose you want to retrieve the first 7 rows of the dataset. You can get it below.
df.head(7)
Display first 7 rows | Image by Author
This function helps you to get the last few rows of the dataset. By default, it returns the last 5 rows, and similar to .head(), you can simply mention the desired number of rows in df.tail()
For example, suppose you want to retrieve the last 3 rows of the dataset. You can get it below.
df.tail(3)
Image by Author
This function is used to get a randomly selected row, column, or both from a dataset. df.sample() takes 7 optional parameters, which means this function can be run without using any argument as below.
df.sample()
As you can see, this returned only a single row output.
You can also specify the desired number of rows, and those many rows will be randomly selected.
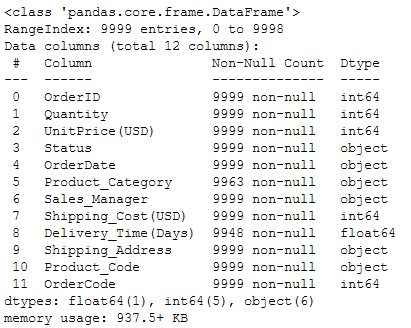
This function returns a quick summary of the DataFrame. This includes information about column names and their respective data types, missing values, and memory consumption by DataFrame, as shown below.
df.info()
Display information about DataFrame | Image by Author
So ideally, this function covers all the information which can be retrieved by individual methods such as df.dtypes, df.columns, df.shape.
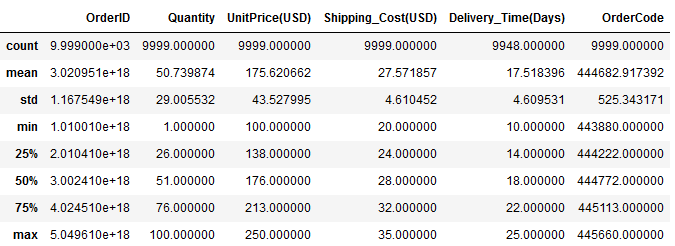
This function returns descriptive statistics about the data. This includes minimum, maximum, mean (central tendency), standard deviation (dispersion) of the values in numerical columns, and the count of all non-null values in the data, as shown below.
df.describe()
By default, descriptive statistics are generated for all the numerical columns.
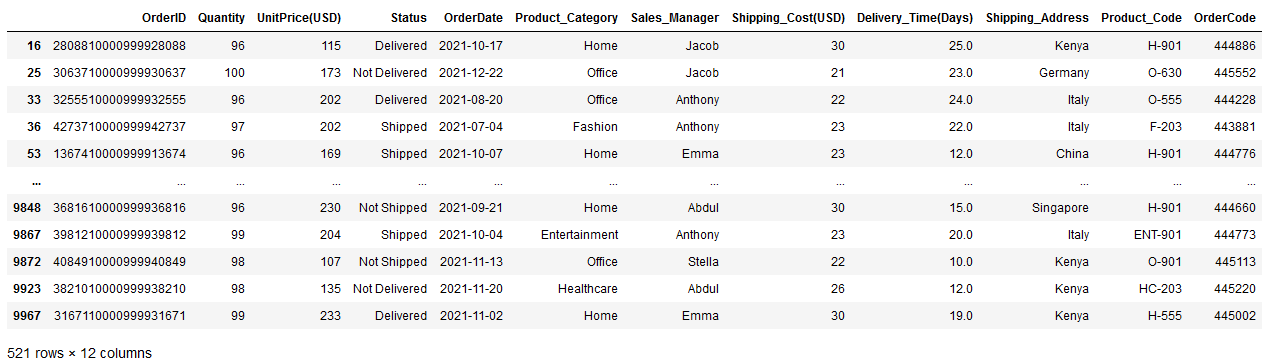
This function is used to query the DataFrame based on an expression. An expression can be as simple as a single condition and as complex as a combination of multiple conditions.
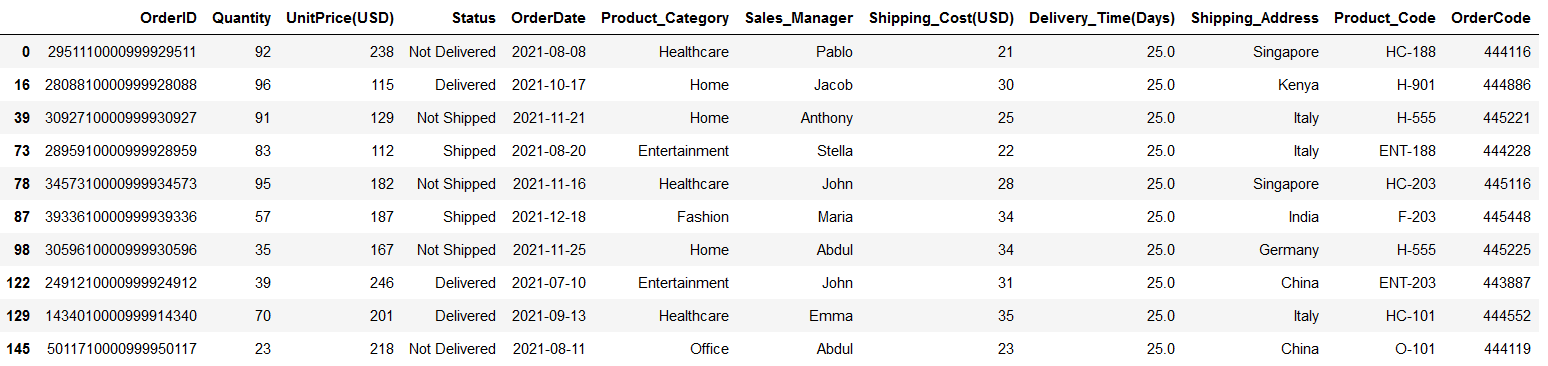
For instance, suppose you want to retrieve all the rows df where the Quantity is more than 95. You simply need to pass this condition as an expression, as shown below.
df.query("Quantity > 95")
df.query() | Image by Author
It returns a large subset of df with 521 rows.
This function is a property of DataFrame that returns the group of rows and columns identified by their labels or names.
So you can access a row and column combination as below,
df.loc[100,'Sales_Manager']
## Output
'John'
In this case, the row label and row number are the same — 100
This function is again the DataFrame property which returns the same output as df.loc, but uses row and column numbers instead of their labels.
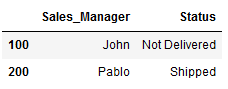
df.iloc[[100, 200],[6,3]]
df.iloc | Image by AuthorThe 6 and 3 are the column numbers for columns Sales_Manager and Status, respectively which you can see in df.info() function.
To learn more about df.loc and df.iloc, I highly recommend reading Select Data in Python Pandas Easily with loc & iloc
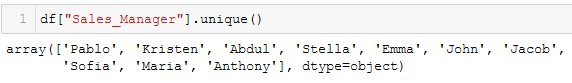
This function returns the list of unique values in a column or series. Instead of applying on complete DataFrame, it works only on the selected single column.
For example, you can see which different sales managers are present in the dataset using this function as below,
df["Sales_Manager"].unique()
df.unique() | Image by Author
This method returns the number of unique records in each column. Similar to the previous function, df.nunique() can be used on single column as,
df["Sales_Manager"].nunique()
## Output
10
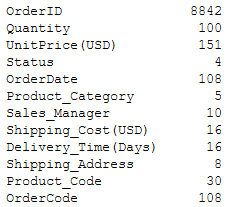
Additionally, it can take the entire DataFrame as input and return the number of unique elements in each column. And you literally do not need to pass any arguments to this function.
df.nunique()
df.nunique() | Image by Author
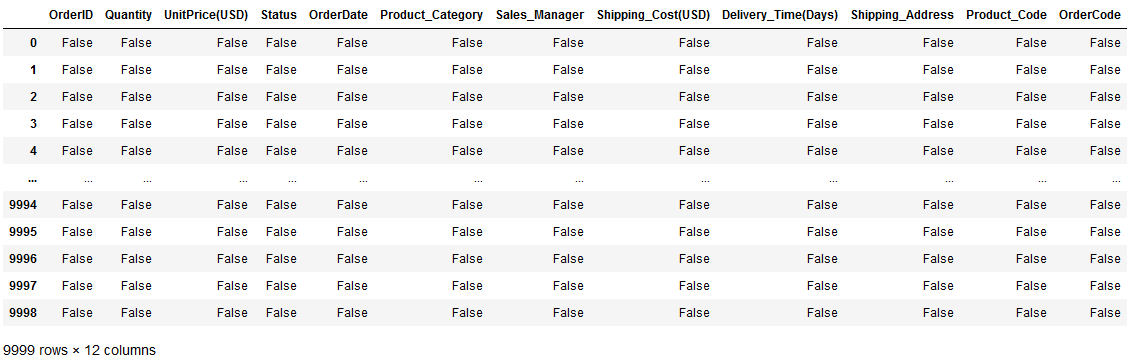
This function helps you to check if there in which row and which column your data has missing values.
From df.info() you already know which columns have missing values. df.isnull() returns output in Boolean form — in terms of True and False — for all the rows in all columns.
So, when the value at a position is missing, df.isnull() returns True for that position and returns for all other positions.
df.isnull()
df.isnull() | Image by Author
As you can see, it basically returned a table of True and False of the same size as df .
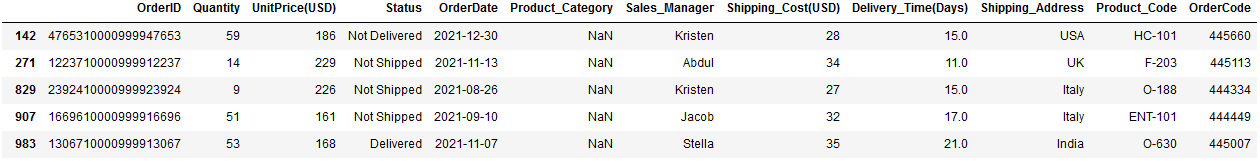
For example, suppose you want to select a subset of df, where the Product Category is missing. You can do it as below,
df2 = df[df["Product_Category"].isnull()]
df2
df.isnull() | Image by Author
In this way, you can understand if there are any trends associated with missing data.
This function is used to replace missing values or NaN in the df with user-defined values. df.fillna() takes 1 required and 5 optional parameters.
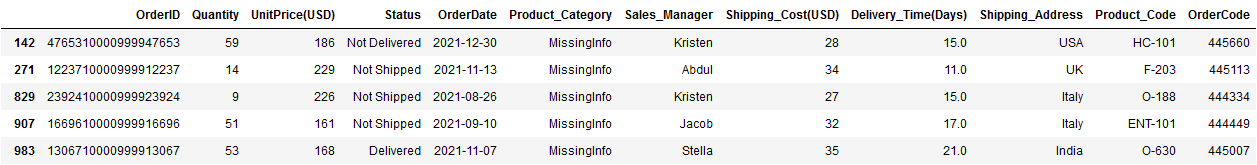
The simplest use — case is filling a fixed value in the place of all missing values in a dataset. For example, suppose you want to replace all the NaN in the above DataFrame df2 with a string ‘MissingInfo’ , which can be done as,
df2.fillna("MissingInfo")
df2.fillna() | Image by Author
However, to retain the filled values in the DataFrame, you need to assign True in parameter inplace in df.fillna()
This function helps to arrange the entire DataFrame in ascending or descending order based on a specified column. It takes exactly 1 required and 5 optional parameters.
For instance, suppose you want to sort a df in ascending order of Quantity — which means records with the lowest quantity will appear on top. All you need to do is pass the column Quantity to this function as below.
df.sort_values("Quantity")
Ascending sorting | Image by Author
To sort the same DataFrame in descending order, you should use one of the optional parameters — ascending — by default, this parameter is set to True. You can arrange the DataFrame in descending order by making this parameter False.
This function returns — how many times a value appeared in a column. So, you need to pass the specific column name to this function
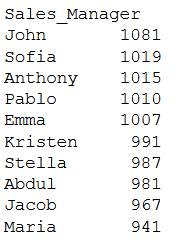
For example, when you want to count how many orders every sales manager handled, all you need to do is —
df.value_counts("Sales_Manager")
Image by Author
This function is useful in quickly getting several largest values from a specific column of the DataFrame and all the rows containing that.
for example, getting the top 10 largest Delivery times in the dataset is possible with —
df.nlargest(10, "Delivery_Time(Days)")
Image by Author
Similar to the previous function, df.nsmallest() helps you in getting several smallest values in the dataset.
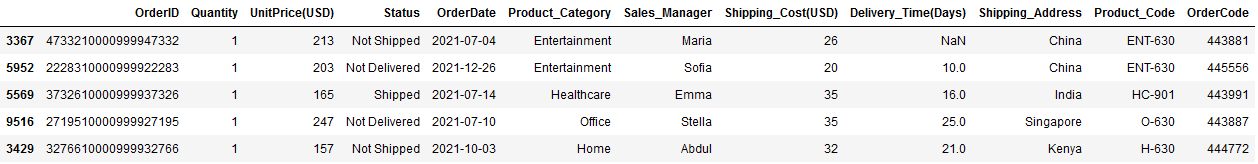
For example, you can get the top 7 smallest shipping costs in the dataset using —
df.nsmallest(7, "Shipping_Cost(USD)")
Image by Author
Both df.nlargest() and df.nsmallest() take exactly 2 required and 1 optional parameters. You can learn more about it here.
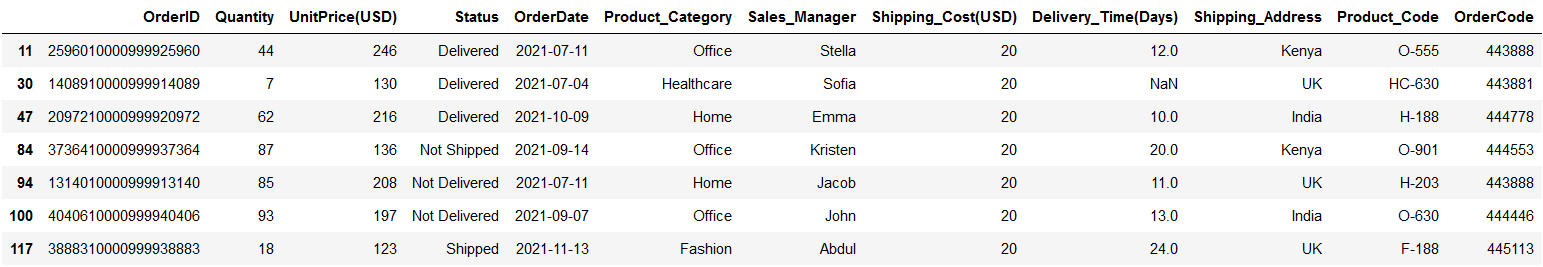
This is useful in copying the entire DataFrame in one go. It contains only one optional parameter, which you probably never need to use.
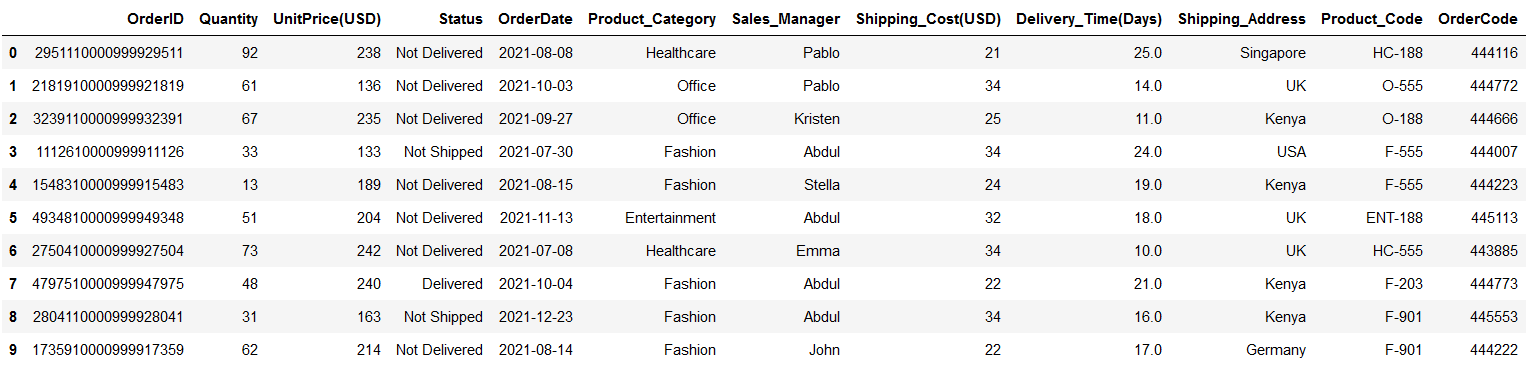
For example, you can copy a subset of df into df1 as below,
df1 = df.iloc[0:10, :].copy()
df1
Image by Author
So, by default, this copy is a deep copy which means, after copying the original DataFrame into new one, whatever changes you make to any of these DataFrames will not be reflected in the other.
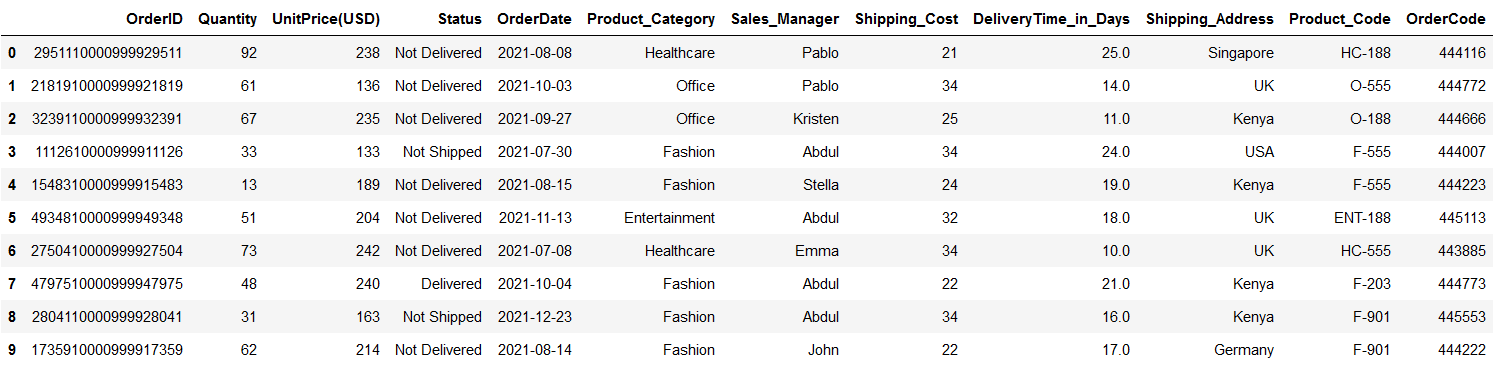
This is the simplest method to easily change the selected column name. all you need to do is pass a dictionary where the key is the old column name and the value is the new column name.
For instance, suppose you want to change the columns Shipping_Cost(USD) and Delivery_Time(Days) to Shipping_Cost and DeliveryTime_in_Days . This is quite simple using this function.
df1.rename(columns = {"Shipping_Cost(USD)": "Shipping_Cost",
 "Delivery_Time(Days)":"DeliveryTime_in_Days"},
 inplace=True)
df1
Image by Author
Don’t forget the second parameter inplace to retain the changes you made in the column names.
This function checks the DataFrame for a given condition and replaces values at all the locations with NaN where the condition is False.
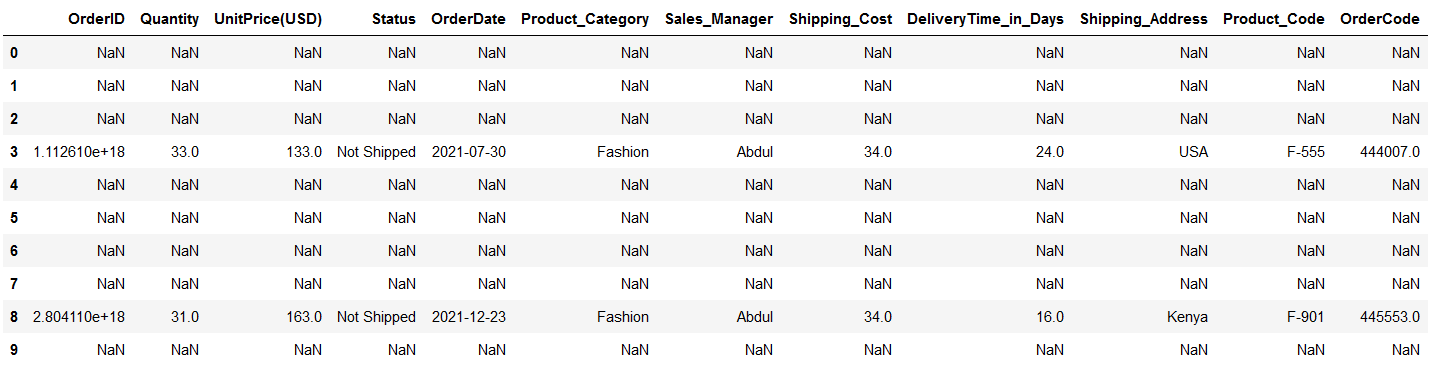
Suppose you have conditions to check — Status = ‘Not Shipped’ . You need to pass this condition in df.where() as —
condition = df1["Status"] == "Not Shipped"
df1.where(condition)
Image by Author
Alternatively, you can also specify which value you would like to substitute when the condition is false, as below,
condition = df1["Status"] == "Not Shipped"
df1.where(condition, 'Condition_False')
This function is used to remove specified rows or columns from a DataFrame. The rows to be removed are identified by their labels or index, and columns are identified by their column names.
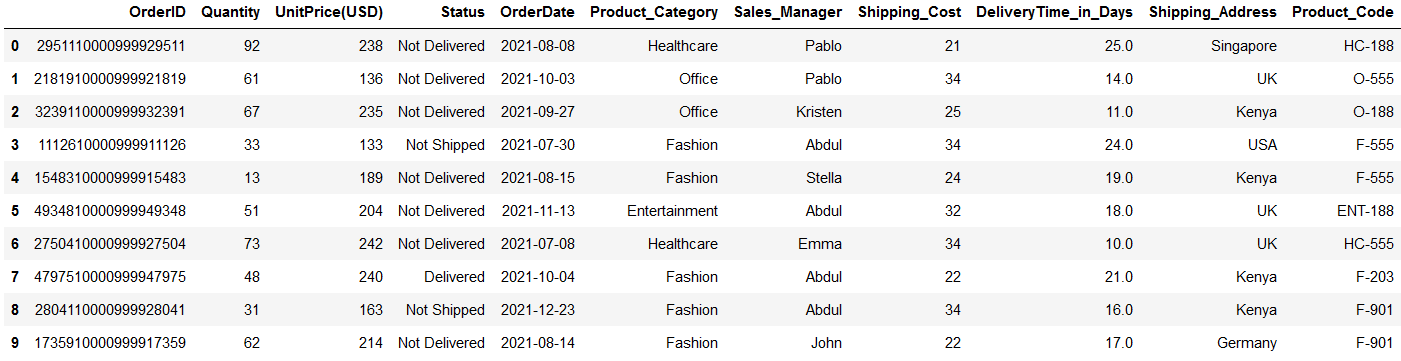
For example, you can remove a column OrderCode using the below code block.
df1.drop("OrderCode", axis=1)
Image by Author
However, to remove it forever, you need to make inplace=True in df.drop()
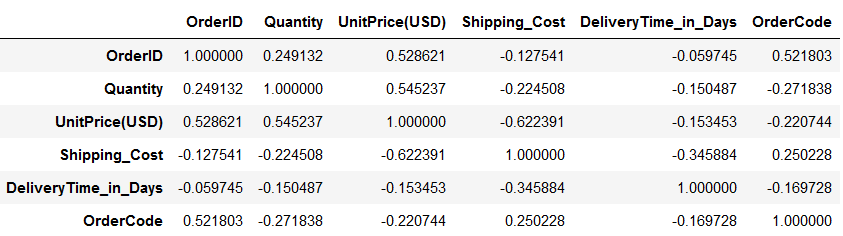
This method is used to find out pairwise correlations between all the columns of the DataFrame. So, when you do not mention any specific column names, it returns Pearson correlation coefficients for all the column pairs in the datasets.
df1.corr()
Image by Author
However, as below, you can always apply this method on selected columns only.
df1[["Quantity","Shipping_Cost"]].corr()
I hope you find this article about Pandas useful. This covers most of the commonly used functions and methods used in Python pandas which you will use in your data analysis tasks.
Key takeaways from this read –
Feel free to download a complete notebook with all these examples from my Github
The media shown in this article is not owned by Analytics Vidhya and is used at the Author’s discretion.
Analytics Professional | I write about Data Science, Python and SQL
Follow me on Medium to get amazing tips on learning data science, changing job domains and winning job interviews. Join Medium Today with My referral link. https://medium.com/@17.rsuraj/membership
Also, Join my email list with 3K+ other readers https://medium.com/subscribe/@17.rsuraj
GPT-4 vs. Llama 3.1 – Which Model is Better?
Llama-3.1-Storm-8B: The 8B LLM Powerhouse Surpa...
A Comprehensive Guide to Building Agentic RAG S...
Top 10 Machine Learning Algorithms in 2026
45 Questions to Test a Data Scientist on Basics...
90+ Python Interview Questions and Answers (202...
8 Easy Ways to Access ChatGPT for Free
Prompt Engineering: Definition, Examples, Tips ...
What is LangChain?
What is Retrieval-Augmented Generation (RAG)?
Edit
Resend OTP
Resend OTP in 45s