 |
VOOZH | about |
|
VOOZH | about |
In the era of big data and rapid technological advancement, the ability to analyze and interpret data effectively has become a cornerstone of decision-making and innovation. Python, renowned for its simplicity and versatility, has emerged as the leading programming language for data analysis. Its extensive library ecosystem enables users to seamlessly handle diverse tasks, from data manipulation and visualization to advanced statistical modeling and machine learning. This article explores the top 10 Python libraries for data analysis. Whether you’re a beginner or an experienced professional, these libraries offer scalable and efficient solutions to tackle today’s data challenges.
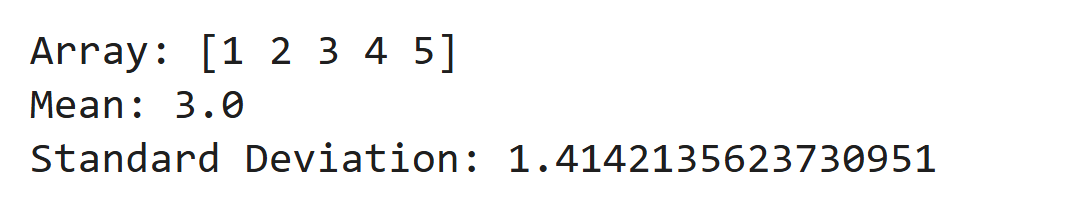
NumPy is the foundation for numerical computing in Python. This Python library for data analysis supports large arrays and matrices and provides a collection of mathematical functions for operating on these data structures.
Advantages:
Limitations:
import numpy as np

# Creating an array and performing operations
data = np.array([1, 2, 3, 4, 5])
print("Array:", data)
print("Mean:", np.mean(data))
print("Standard Deviation:", np.std(data))
Output
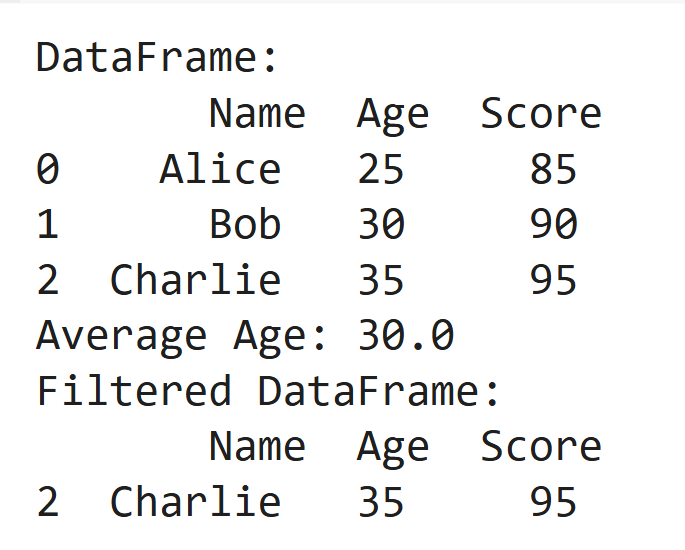
Pandas is a data manipulation and analysis library that introduces DataFrames for tabular data, making it easy to clean and manipulate structured datasets.
Advantages:
Limitations:
import pandas as pd

# Creating a DataFrame
data = pd.DataFrame({'Name': ['Alice', 'Bob', 'Charlie'], 'Age': [25, 30, 35], 'Score': [85, 90, 95]})
print("DataFrame:\n", data)

# Data manipulation
print("Average Age:", data['Age'].mean())
print("Filtered DataFrame:\n", data[data['Score'] > 90])
Output
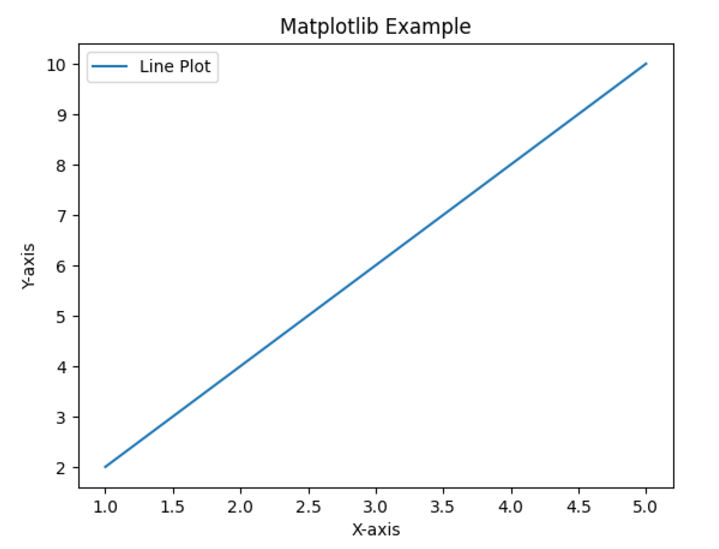
Matplotlib is a plotting library that enables the creation of static, interactive, and animated visualizations.
Advantages:
Limitations:
import matplotlib.pyplot as plt

# Data for plotting
x = [1, 2, 3, 4, 5]
y = [2, 4, 6, 8, 10]

# Plotting
plt.plot(x, y, label="Line Plot")
plt.xlabel('X-axis')
plt.ylabel('Y-axis')
plt.title('Matplotlib Example')
plt.legend()
plt.show()
Output
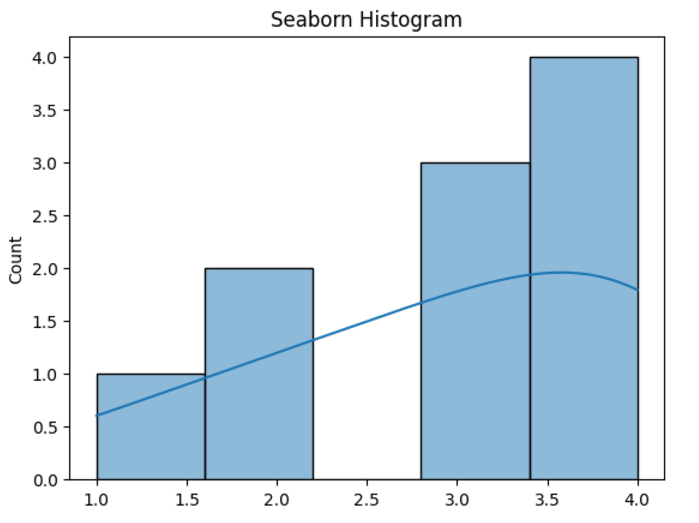
Seaborn, Python library for data analysis, is built on Matplotlib and simplifies the creation of statistical visualizations with a focus on attractive aesthetics.
Advantages:
Limitations:
import seaborn as sns
import matplotlib.pyplot as plt

# Sample data
data = [1, 2, 2, 3, 3, 3, 4, 4, 4, 4]

# Plotting a histogram
sns.histplot(data, kde=True)
plt.title('Seaborn Histogram')
plt.show()
Output
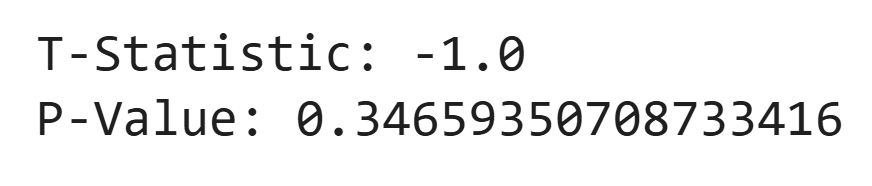
SciPy builds on NumPy to provide tools for scientific computing, including modules for optimization, integration, and signal processing.
Advantages:
Limitations:
from scipy.stats import ttest_ind

# Sample data
group1 = [1, 2, 3, 4, 5]
group2 = [2, 3, 4, 5, 6]

# T-test
t_stat, p_value = ttest_ind(group1, group2)
print("T-Statistic:", t_stat)
print("P-Value:", p_value)
Output
Scikit-learn is a machine learning library, offering classification, regression, clustering, and more tools.
Advantages:
Limitations:
from sklearn.linear_model import LinearRegression

# Data
X = [[1], [2], [3], [4]] # Features
y = [2, 4, 6, 8] # Target

# Model
model = LinearRegression()
model.fit(X, y)
print("Prediction for X=5:", model.predict([[5]])[0])
Output
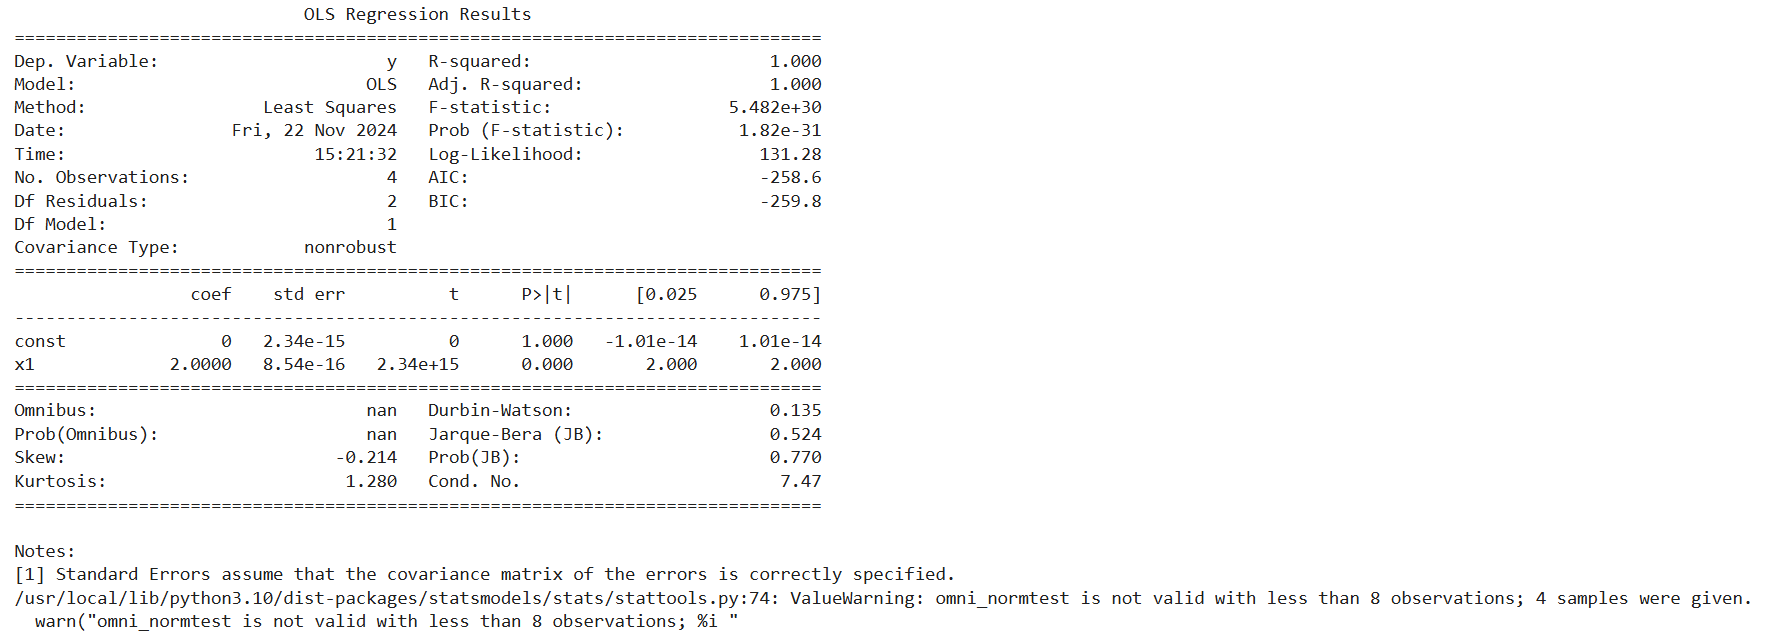
Statsmodels, Python library for data analysis, provides tools for statistical modeling and hypothesis testing, including linear models and time series analysis.
Advantages:
Limitations:
import statsmodels.api as sm

# Data
X = [1, 2, 3, 4]
y = [2, 4, 6, 8]
X = sm.add_constant(X) # Add constant for intercept

# Model
model = sm.OLS(y, X).fit()
print(model.summary())
Output
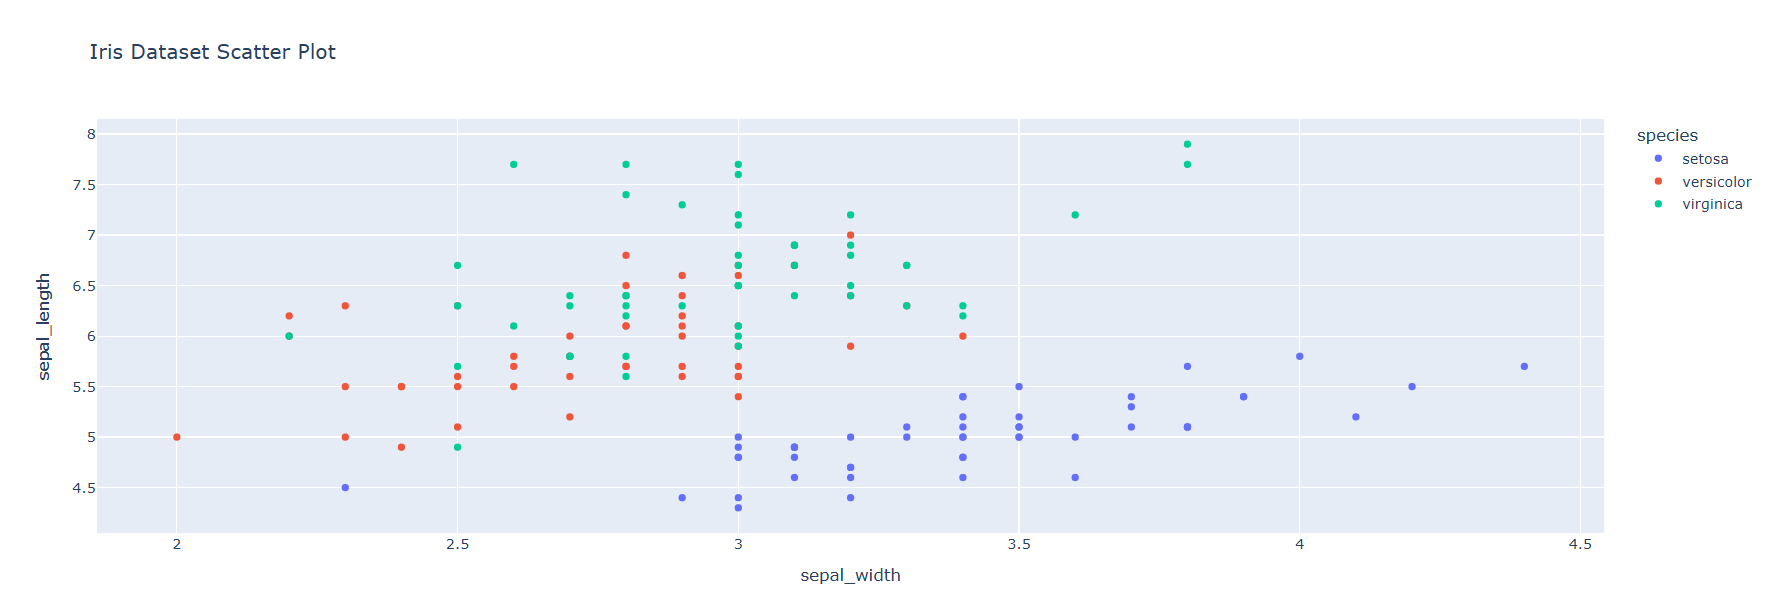
Plotly is an interactive plotting library used for creating web-based dashboards and visualizations.
Advantages:
Limitations:
import plotly.express as px

# Sample data
data = px.data.iris()

# Scatter plot
fig = px.scatter(data, x="sepal_width", y="sepal_length", color="species", title="Iris Dataset Scatter Plot")
fig.show()
Output
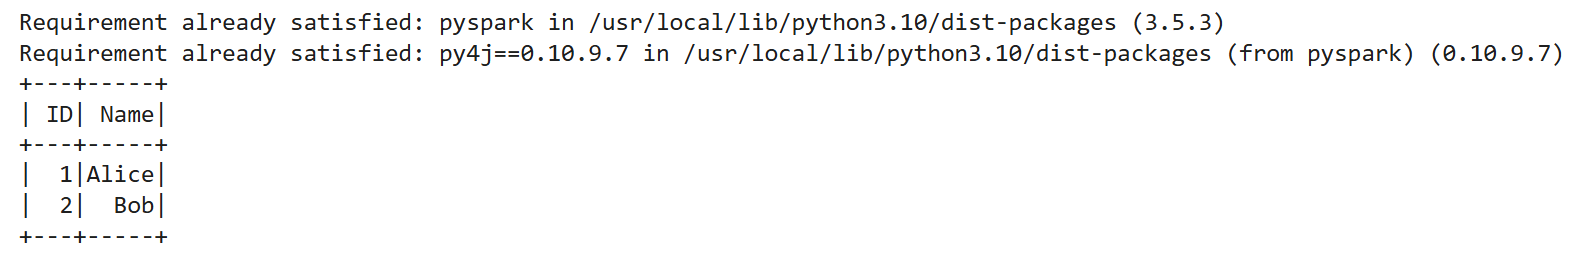
PySpark is the Python API for Apache Spark, enabling large-scale data processing and distributed computing.
Advantages:
Limitations:
!pip install pyspark

from pyspark.sql import SparkSession

# Initialize Spark session
spark = SparkSession.builder.appName("PySpark Example").getOrCreate()

# Create a DataFrame
data = spark.createDataFrame([(1, "Alice"), (2, "Bob")], ["ID", "Name"])
data.show()
Output
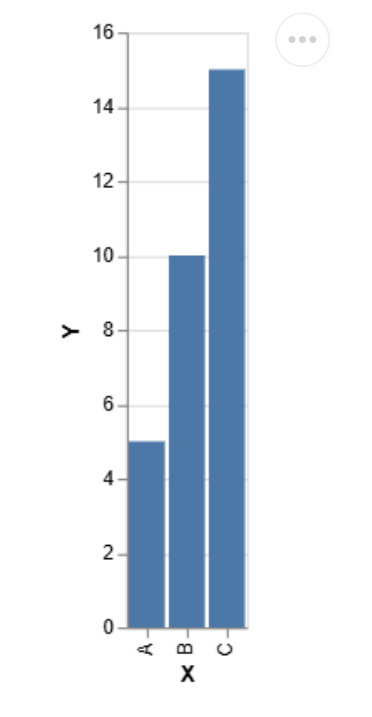
Altair is a declarative statistical visualization library based on Vega and Vega-Lite.
Advantages:
Limitations:
import altair as alt

import pandas as pd


# Simple bar chart

data = pd.DataFrame({'X': ['A', 'B', 'C'], 'Y': [5, 10, 15]})

chart = alt.Chart(data).mark_bar().encode(x='X', y='Y')

chart.display()
Output
The first step in selecting a Python library for data analysis is understanding the specific requirements of your task. Pandas and NumPy are excellent data cleaning and manipulation choices, offering powerful tools to handle structured datasets. Matplotlib provides basic plotting capabilities for data visualisation, while Seaborn creates visually appealing statistical charts. If interactive visualizations are needed, library like Plotly are ideal. When it comes to statistical analysis, Statsmodels excels in hypothesis testing, and SciPy is well-suited for performing advanced mathematical operations.
The size of your dataset can influence the choice of libraries. Pandas and NumPy operate efficiently for small to medium-sized datasets. However, when dealing with large datasets or distributed systems, tools like PySpark are better options. These Python libraries are designed to process data across multiple nodes, making them ideal for big data environments.
Your analysis goals also guide the library selection. For Exploratory Data Analysis (EDA), Pandas is a go-to for data inspection, and Seaborn is useful for generating visual insights. For predictive modeling, Scikit-learn offers an extensive toolkit for preprocessing and implementing machine learning algorithms. If your focus is on statistical modeling, Statsmodels shines with features like regression analysis and time series forecasting.
Libraries vary in usability and complexity. Beginners should start with user-friendly libraries like Pandas and Matplotlib, supported by extensive documentation and examples. Advanced users can explore more complex tools like SciPy, Scikit-learn, and PySpark, which are suitable for high-level tasks but may require a deeper understanding.
Lastly, ensure the library integrates seamlessly with your existing tools or platforms. For instance, Matplotlib works exceptionally well within Jupyter Notebooks, a popular environment for data analysis. Similarly, PySpark is designed for compatibility with Apache Spark, making it ideal for distributed computing tasks. Choosing libraries that align with your workflow will streamline the analysis process.
Python’s dominance in data analysis stems from several key advantages:
Python’s vast and diverse library ecosystem makes it a powerhouse for data analysis, capable of addressing tasks ranging from data cleaning and transformation to advanced statistical modeling and visualization. Whether you’re a beginner exploring foundational libraries like NumPy, Pandas, and Matplotlib, or an advanced user leveraging the capabilities of Scikit-learn, PySpark, or Plotly, Python offers tools tailored to every stage of the data workflow.
Choosing the right library hinges on understanding your task, dataset size, and analysis objectives while considering usability and integration with your existing environment. With Python, the possibilities for extracting actionable insights from data are nearly limitless, solidifying its status as an essential tool in today’s data-driven world.
A 23-year-old, pursuing her Master's in English, an avid reader, and a melophile. My all-time favorite quote is by Albus Dumbledore - "Happiness can be found even in the darkest of times if one remembers to turn on the light."
GPT-4 vs. Llama 3.1 – Which Model is Better?
Llama-3.1-Storm-8B: The 8B LLM Powerhouse Surpa...
A Comprehensive Guide to Building Agentic RAG S...
Top 10 Machine Learning Algorithms in 2026
45 Questions to Test a Data Scientist on Basics...
90+ Python Interview Questions and Answers (202...
8 Easy Ways to Access ChatGPT for Free
Prompt Engineering: Definition, Examples, Tips ...
What is LangChain?
What is Retrieval-Augmented Generation (RAG)?
Edit
Resend OTP
Resend OTP in 45s